In this article we will see
how we can use the Watches and Notifications.
- Watch: this component is used to monitor the MBean attributes.
- Notification: this component
includes the events which are triggered based on the values set in the
watch. There can be different types of alert like SNMP alerts, JMS Messages, JMX notifications
etc.
In this article
we will see how we can use Weblogic WLDF to interact with JMS along with the
configuration of the Watch and Notifications
Create a WLDF Diagnostic Module
1. Click on the Diagnostic Modules in the Weblogic Console
2. In the next Screen, enter the name for the Diagnostic Module. Save
Even though the Diagnostic module was created, it did not have any
metrics enabled. Click
on the newly Created Diagnostic module and select the Configuration tab
and Collected Metrics sub tab.
3. Click New in the Configuration tab.
4. In the next screen we can choose between “Server runtime” and “Domain
runtime” metrics. (The former means that metrics will be collected at
server level; the other option, Domain Runtime, provides access to the Domain
Wide metrics and is available only for the Admin Server)
Select the ‘Domain Runtime’
Metric

5. In the next
Screen, Select the ‘weblogic.management.runtime.JVMRuntimeMBean’

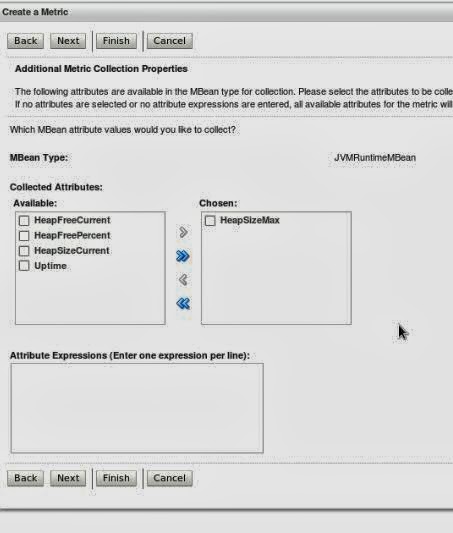
6. In the next
screen, specify
which attribute of the Mbean you want to monitor. For instance select
‘HeapSizeMax’.
7. In the next Screen, select
the server instance which you want to monitor. Click finish and the collection
metrics is created.

The Watch
and Notification system can be used to create automated monitors that observe
specific diagnostic state and send notifications based on configured rules.
Watch:- It
is basically used to monitor the Mbean attributes.
Notifications:
There are the events which are triggered based on the values set in the watch.
There can be different kind of alerts like SNMP alerts, JMS Messages, JMX
notifications etc.
Now let’s
create a notification first which sends notification messages to the JMS Sub System.
For this we need to Configure JMS In weblogic which is available here.
Create a Notification
1. Click the
Newly Created Diagnostic Module.
2. Click on
the Watches and Notifications tab.
3. Go to the
Notification tab and click New.
4. In the next
Screen, select the Type as ‘JMS Message’

5. In the
next Screen, Enter a Name for the Notification. Make Sure ‘enable notification’
check box is checked.

6. In the
next screen enter a the JMS Details, in this case , JNDI name is ‘Queue1’ and
Connection Factory JNDI Name is “CF1’

7. Click
Finish
Create a Watch
1. Click the
Newly Created Diagnostic Module.
2. Click on
the Watches and Notifications tab.
3. Go to the
Watch tab and click New.
4. In the
next screen, enter the watch name and watch Type as ‘Collected Metrics’ and
make sure ‘enable Watch’ is checked.

5. In the next
screen, Click on the Add Expression button which takes us to the next screen.

6. In the
next screen, select the ‘Domain Runtime’ for MBean Server Location.

7. In the
next screen , select the ‘weblogic.management.runtime.JVMRuntimeMBean’ for the
MBean type.

8. In the next screen, select the Instance

9. In the next screen, enter the Details
Message
Attribute = HeapSizeMax
Operator =
>
Value = 10

and click on
Finish to come back to the Create watch.
10. In the
next Screen make sure to check ‘Use an automatic reset alarm’.

11. In the last
screen, select the Notifications available to Choosen.

12. Finish
Target the WLDF to any of the servers whose
MBeans are monitored.
Now Check
the Server logs to see
WatchRuleType:
Harvester
WatchRule: (${DomainRuntime//[weblogic.management.runtime.JVMRuntimeMBean]com.bea:Location=AdminServer,Name=AdminServer.......)
WatchData: com.bea:Location=AdminServer,Name=AdminServer,ServerRuntime=AdminServer,Type=JVMRuntime//HeapSizeMax = 477233152
WatchAlarmType: AutomaticReset
WatchAlarmResetPeriod: 60000
If we compile the QueueReceive.java class in the here , we can see messages coming like
Message Received: MapMessage[ID:<114623.1387464249708.0>]
Message Received: MapMessage[ID:<114623.1387464319708.0>]
Message Received: MapMessage[ID:<114623.1387464319708.0>]
More to Come , Happy Learning
