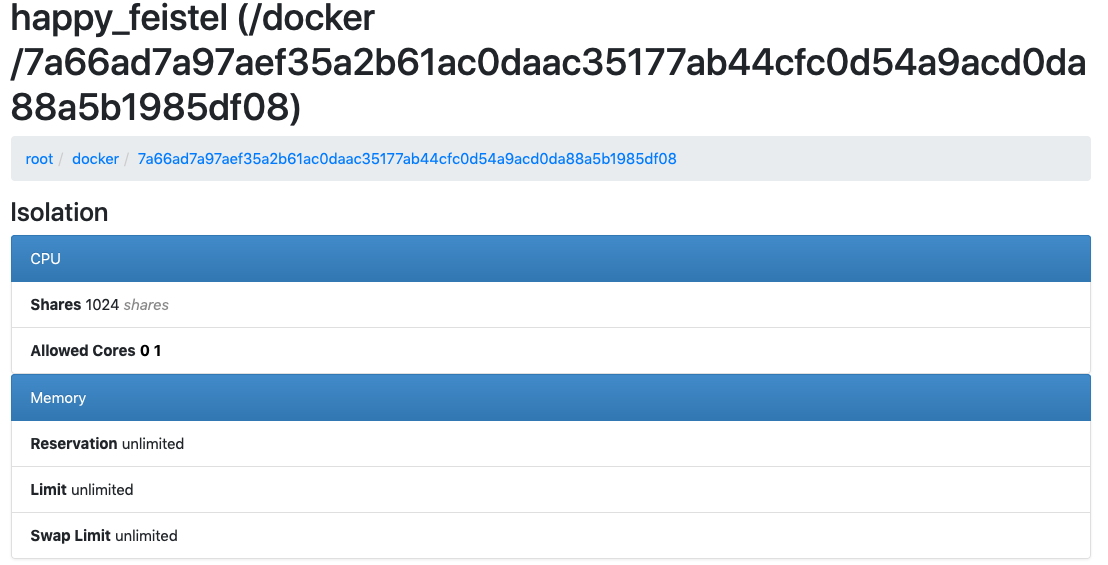
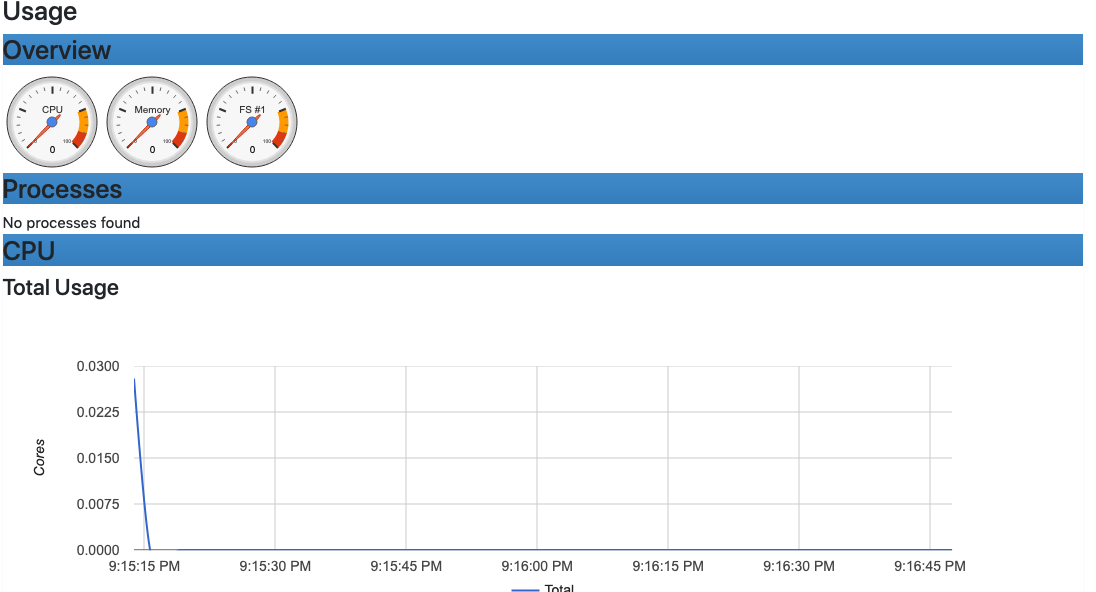
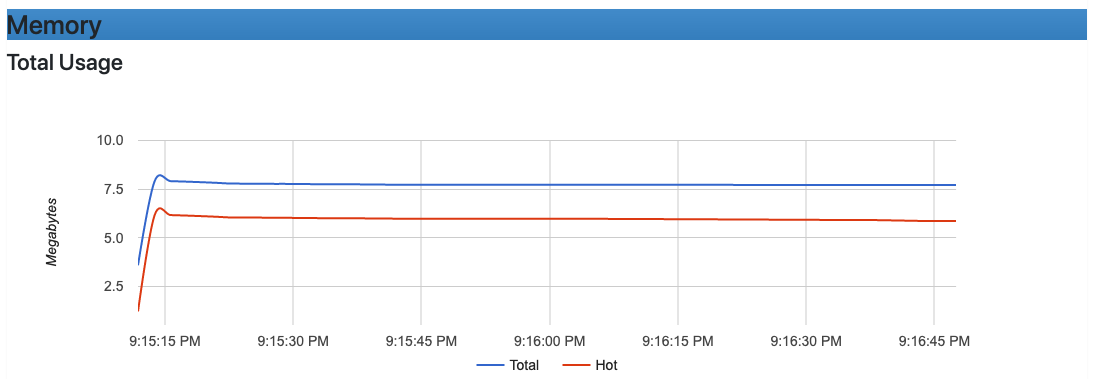
Weave Scope is an advanced container troubleshooting and monitoring tool for Docker,Kubernetes and Amazon ECS. It not just monitors but provides additional capabilities like mapping application containers. In this article we will see the basics of Weave Scope and how it works.
Introducting WeaveScope
Weave Scope lets you monitor and control your containerized microservices applications. By providing a visual map of your Docker Containers, you can see the dependencies and communication links between them. Scope automatically detects processes, containers, hosts. No kernel modules, no agents, no special libraries, no coding.
The best feature of Weavescope is that it automatically generates a map of your application, enabling you to intuitively understand, monitor, and control your containerized, microservices-based application. For instance, if we have multiple front end and backend applications connecting to each other, weave will identify the connections and will generate a map for visualization.
Some of the best features of Weavescope are,
Manage and Montior containers in real time : provides an overview of the Container infrastructure, or foucs on a specific microservice. Helps in Easily identify and correct issues regarding the microservice.
Helps in interacting with the Container: We can directly launch a Command line from the Dashboard directly to the container for debugging and troubleshooting.
Metadata about the Containers : View contextual metrics, tags, and metadata for your containers
Map you architecture : Provides a detailed mapping of linked containers and infrastructure.
Installing WeaveScope : Installing WeaveScope is Quite Easy,
jagadishm@[/Volumes/Work]: sudo wget -O /usr/local/bin/scope \
https://github.com/weaveworks/scope/releases/download/latest_release/scope
jagadishm@[/Volumes/Work]: sudo chmod a+x /usr/local/bin/scope
jagadishm@[/Volumes/Work]: sudo scope launch
the UI is accessible on port 4040. Use the link below to visualize the Docker host. http://
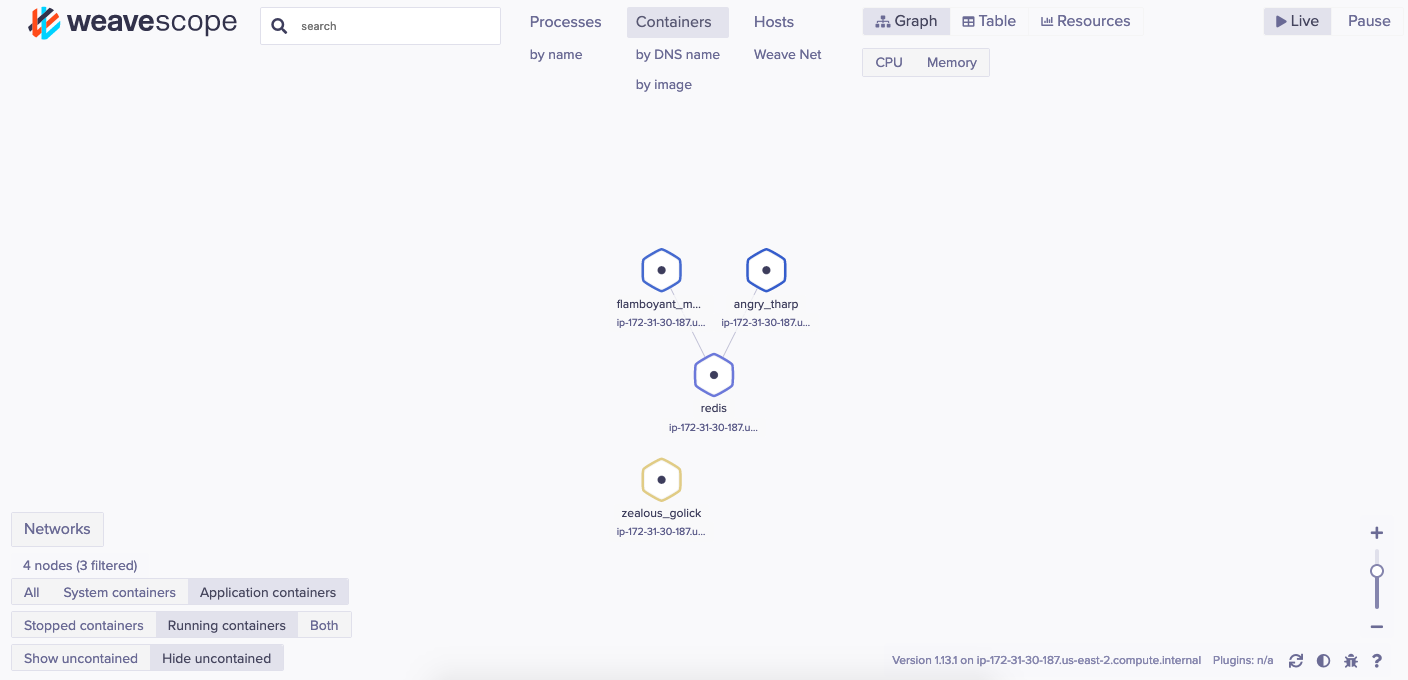
Weave Scope automatically identifies newly created containers and will show that on the Dashboard. From the UI you can see links and explore the details of each container node. These include CPU usage, TCP connections and memory load.The UI also allows you to attach and launch a shell prompt inside the container. By clicking on a node (the hexagon in Scope) you can find out more information about the container. The Container resource details are shown as below,

A Container shell can be triggered with the options available on the Container. If we see the below image, every container that we click will provide, attach, Exec Shell, Restart, pause and Stop options on the popup that open on clicking the container.
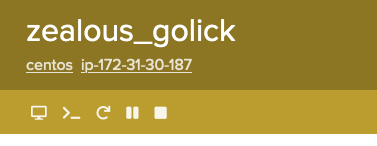
Click on the "exec Shell" to see a terminal is opened for the container where we can login to the container and perform actions like below,

Hope this helps in starting weavescope for container monitoring and managing.