Pages

Monday, January 10, 2022

Kubernetes - Ephemeral Container : Copy Of Pod By Changing Image

Most of the time, developers deploy their application in small sized images which does not contain any debugging utilities. As a practice, they deploy the code in distroless images. But when that application is misbehaving, kubernetes provides us a way to change that container image to another image which contain debugging utilities.

Create a Image using the Image BusyBox as below,
[root@ec2-3-138-100-101 ec2-user]# kubectl run myapp --image=busybox --restart=Never -- sleep 1d
pod/myapp created

[root@ec2-3-138-100-101 ec2-user]# kubectl  describe pod myapp | grep Image
Image:         busybox
Image ID:      docker-pullable://busybox@sha256:5acba83a746c7608ed544

We can see that the pod is created with the busybox image. Now create another debugging pod for the above one but with ubuntu image as below,

[root@ec2-3-138-100-101 ec2-user]# kubectl debug myapp --copy-to=myapp-debug --set-image=*=ubuntu

We can check the debugging image as below,
[root@ec2-3-138-100-101 ec2-user]# kubectl describe pod myapp-debug | grep Image
Image:         ubuntu
Image ID:      docker-pullable://ubuntu@sha256:b5a61709a9a44284d882342

We can see that we can create another pod with our application pod but with different image so that we can troubleshoot the code
Read More

Docker - Running Container in privileged mode


With new security restrictions, developers are running their code in a more secured area. They are running their code in containers with less privileges, non root and secure images. But there are times where we need to provide additional privileges to things running inside.

Docker provides us with a privileged mode which grants a docker container root capabilities to all devices on the host machine. Running a container in a privileged mode gives all the capabilities of the host machine. This gives access to Host kernel and device access even.

Lets create a container with the privileged mode as below,
[root]# docker run -it --privileged ubuntu

We can check the privileged mode as below,
[root]# docker inspect --format='{{.HostConfig.Privileged}}' d2973c618caf
true

Now from inside the container we can perform multiple root level operations like mounting a new file system as below,
[root]# mount -t tmpfs none /mnt
[root]# df -h
Filesystem      Size  Used Avail Use% Mounted on
overlay          20G  4.3G   16G  22% /
tmpfs            64M     0   64M   0% /dev
tmpfs           3.9G     0  3.9G   0% /sys/fs/cgroup
shm              64M     0   64M   0% /dev/shm
/dev/xvda1       20G  4.3G   16G  22% /etc/hosts
none            3.9G     0  3.9G   0% /mnt

Allowing a Container root access makes a system open to attacks. A malicious code running inside the privileged container can gain access completely to the host machine and cause serious damage to not just the system but the whole Infrastructure. Hope this helps in understanding Privileged Mode in Containers
Read More

Kubernetes - Static pods

We know that the pods are created and managed by the Api-server. Though the pods are created in the worker nodes by the kubelet running on those nodes, the details are first managed by the api-server and will ask this kubelet to create the pod. This means the management of this pod will be taken care of by the api-server. These pods are continuously managed and observed by the api-server

But there is another type of pod that is managed directly by the kubelet rather than the api-server. This means the pod created by the kubelet is managed by the kubelet by itself. Control plane is not involved in the lifecycle of the static pod. In addition to this, kubelet also tries to create a mirror pod on the kubernetes api-server for each static pod so that the static pods are visible when we list the pods.Static pods are usually used by software bootstrapping kubernetes itself. For example, kubeadm uses static pods to bring up kubernetes control plane components like api-server, controller-manager as static pods. Since the static pods are managed by the Kubelet itself, we need to create these static pods on any of the worker nodes.


kubelet can watch a directory on the host file system (configured using --pod-manifest-path argument to kubelet) or sync pod manifests from a web url periodically (configured using --manifest-url argument to kubelet). When kubeadm is bringing up the kubernetes control plane, it generates pod manifests for api-server, controller-manager in a directory which kubelet is monitoring. Then kubelet brings up these control plane components as static pods. In this article, we will see how we can create a Static pod, 


Create a Simple pod definition file as below,

[root@ec2-18-217-122-218 kubelet]# cat /root/staticPod/static-pod.yml 

apiVersion: v1

kind: Pod

metadata:

  name: static-pod

  labels:

    role: app

spec:

  containers:

    - name: app

      image: busybox:1.28

      ports:

        - name: app

          containerPort: 443

          protocol: TCP


Now once the pod definition file is available, we need to identify the kubelet watch directory.  Now check the static pod location where kubelet tries to read. To find this go to,

[root@ec2-18-217-122-218 kubelet]# cd /var/lib/kubelet/

[root@ec2-18-217-122-218 kubelet]# cat config.yaml | grep static

staticPodPath: /etc/kubernetes/manifests


We can see the location where kubelet reads for static pod is /etc/kubernetes/manifests


Copy your static pod file over this location and restart the kubelet as below

[root@ec2-18-217-122-218 manifests]#  systemctl restart kubelet


Now after a few seconds, if we do a kubectl get pods from the master node, we can see the mirror pod details as below,

We can see that the static nignx pod, is running.


If we try to delete the pod from the master node, it deletes but the kubelet again starts the pod as below,


kubelet periodically scans the configured directory for static pods and if there are any changes, the kubelet performs them accordingly.


Identify status pod

Since static pods are not controlled by an api-server, the controlled by Element in the pod description shows a different value.  Checking the owner reference of a static pod using kubectl describe command should indicate that such a pod is not controlled by a ReplicaSet but rather from Node/controlplane

So Static pods are introduced for running pods across all or a subset of chosen nodes. This was useful for system service components like log forwarders like fluentd , networking components like kube-proxy. Because of the limitation with the static pods like no health check ets, kubernetes came up with Daemon Sets. 


Hope this helps in understanding Static Pods

Read More

Sunday, January 9, 2022

Kubernetes - Labels, Selector and matchLabels

Labels are a mechanism that we use to organize objects in kubernetes.a K8s object can be anything from containers, pods to services and deployments. Labels are key-value pairs that we can attach to a resource for identification. The labels contain information and are used by kubernetes to query objects based on these labels.


A label can be applied to a pods as shown below,

[jagadishmanchala@Jagadish-theOne:k8s] cat simple-label.yml 

apiVersion: v1

kind: Pod

metadata:

  name: testing-service

  labels:

    env: dev

spec:

  containers:

    - name: test-ser

      image: docker.io/jagadesh1982/testing-service

      ports:

      - containerPort: 9876


From the above config we are actually creating a pod with the label “env=dev”. 


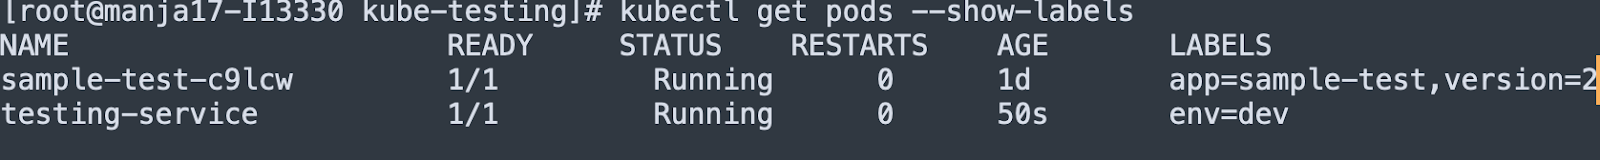
To see the label available for a pod we can use the command,

If we want to assign a label while a pod is running, we can use

Now we can see the labels attached to the pod using,


Consider the below deployment, 

[jagadishmanchala@Jagadish-theOne:k8s] cat simple-label.yml 

apiVersion: apps/v1

kind: Deployment

metadata:

  name: testing-service-v1

  labels:

    app: testing-service

spec:

  replicas: 3

  selector:

    matchLabels:

      app: testing-service

      version: "1.0"

  template:

    metadata:

      labels:

        app: testing-service

        version: "1.0"

    spec:

      containers:

      - name: testing-service

        image: docker.io/jagadesh1982/testing-service

        ports:

        - name: http

          containerPort: 9876

        env:

        - name: VERSION

          value: "1.0"


In the above config, we can see that there are labels defined in multiple places as 


************

metadata:

  name: testing-service-v1

  labels:

    app: testing-service

    tier: backend

spec:

  replicas: 3

  selector:

    matchLabels:

      app: testing-service

  template:

    metadata:

      labels:

        app: testing-service

        tier: backend

************

In the above config, we can see metadata.labels, selector.matchLabels and template.metadata.labels. What are these and in this article we will see what these do exactly?


The first metadata talks about the deployment itself. This means we are assigning a label “app: testing-service” and “tier: backed” to the deployment itself. This means we can delete the deployment using the 

“kubectl delete deploy -l app=testing-service,tier=backend”. This label is used to identify the kind that we are creating which is deployment here.


Now the selector is used for a whole different purpose. Once we create a deployment,replica set or replication controller, pods also get created along. Now we need to tell the deployment how to find the pods that are created.For instance, in future if we want to scale a pod from 1 to 3, the deployment needs to find first what pods are currently running. For this it needs a way to identify the specific pods that are created as a part of deployment. The labels defined in the selector field helps deployment to identify the pods that are created as a part of that deployment. Now from the above configuration it will find all pods that have labels “app: testing-service” and will manage the pods. We call this a selector label. 


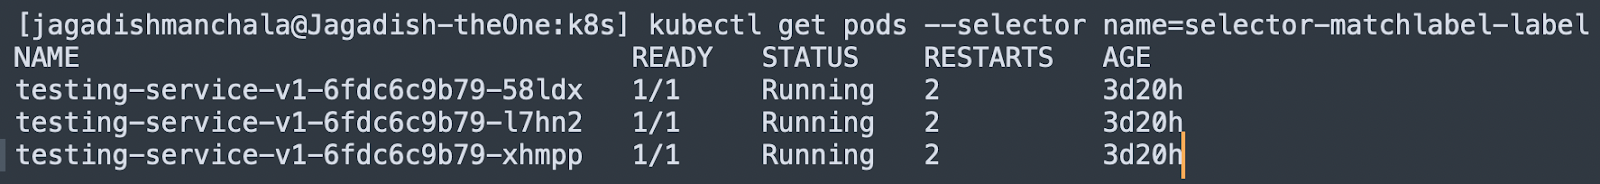
To say exactly , to find out what pods are running or if we need to manage a group of pods we need to find them. The labels defined in the selector fields will help us to find the pods to manage them


But in order to manage or find pods running with a specific selector label, we need to assign them the labels. Once we assign the labels, then only we can find them using the selector. The labels that need to be assigned to the pods are defined in the  template.metadata.labels.


So

.metadata.labels is for labeling the kind that we are creating. In the above case, the kind is deployment. If we want to find the deployment, we can use the labels defined in the metadata.labels


.spec.selector tells the deployment or replica set or replication controller how to find pods to manage , scale or delete.


.spec.template.metadata.labels are used to create the pods with labels so that deployment or replica set or replication controller can find or manage the pods.


In the above case, labels defined in .spec.selector and .spec.template.metadata.labels should be same


Hope this helps in understanding the labels, selectors and podTemplate labels.

Read More

Kubernetes - Ephemeral Container : Copy Of Pod

Sometimes pod configurations do not allow connection for troubleshooting in certain cases. For instance, we can't run the “kubectl exec” command to connect to a container to troubleshoot. For instance, if your container image does not include a shell or if your application crashes on startup. In these situations we can use “kubectl debug” to create a copy of the pod with tools that aid in debugging.

Run the command to create a application container as below,
[root@ec2-3-138-100-101 ~]# kubectl run myapp --image=busybox --restart=Never -- sleep 1d
pod/myapp created

Once the pod is created, create the debug pod and attach to the myapp pod above. In this case we are running this command to create a copy of myapp named myapp-debug that adds a new Ubuntu container for debugging:

[root@ec2-3-138-100-101 ~]# kubectl debug myapp -it --image=ubuntu --share-processes --copy-to=myapp-debug 
Defaulting debug container name to debugger-m897h. If you don't see a command prompt, try pressing enter. 
root@myapp-debug:/#

After a few seconds, the debug pod gets connected to the original myapp pod and we can start the troubleshooting.Process namespace sharing can not be applied to an existing pod, so a copy of the target pod must be created. --share-processes flag enables process namespace sharing when used with --copy-to. These flags copy the existing pod spec definition into a new one with process namespace sharing enabled in the spec.

Read More

Kubernetes - Ephemeral containers

Pods are fundamental units in kubernetes. All applications that we run inside a container run inside a Pod. Many times developers build containers with small base images, most of the times with distroless images based on slimmed versions of distributions. These images will not have a package manager or shell. Only the application and its dependencies are packed and run as containers.

Things go well with the above packed containers until issues come. These issues can be application issues and troubleshooting them can be hard as we don’t have any tools to troubleshoot or package manager to install these tools. The only way is to rebuild the image with troubleshooting tools and re-run the application to troubleshoot the issue. 


Another option provided by Docker is to attach a container to the existing application container on the same network and use the tools available. For instance, we can attach a container which has troubleshooting tools to an application container on the same network space and use tools to troubleshoot things. This is the same concept for Ephemeral containers.


We create a container image with all troubleshooting tools and when needed for debugging, we can deploy this ephemeral container into a running pod and troubleshoot things. Ephemeral containers are an alpha feature in Kubernetes 1.22, so the official recommendation is not to use it in production environments.


In this article, we will see how to use ephemeral containers for debugging things in a running container of pod. 


A simple pod with a ubuntu container looks as below,

[root@ec2-3-138-100-101 ~]# cat ephemeral-example.yml 

apiVersion: v1

kind: Pod

metadata:

  name: single-pod

  labels:

    env: dev

spec:

  containers:

  - name: testing-service

    image: ubuntu

    command: [ "/bin/bash", "-c", "--" ]

    args: [ "while true; do sleep 30; done;" ]


Run the “kubectl create -f ephemeral-example.yml” to create the pod. Now consider for instance we want to test the internet from this container in the pod as below,

We can see that the ping command is not available to troubleshoot our network issues. Now lets create a ephemeral container and attach to this running pod single-pod as below,


[root@ec2-3-138-100-101 ~]# kubectl debug -it single-pod --image=alpine:latest --target=testing-service


In the above command, iam running a ephemeral container with image alpine:latest and attaching to the pod single-pod and to container testing-service running inside the single-pod. Once the ephemeral container is added to the running testing-service container, we can use the ping tool to perform our troubleshooting as below,

Now if come out the command prompt by pressing CTRL P+Q , and describe the pod we can see new entries as Ephemeral container as below,

This is how Ephemeral containers work. We Can create a container image which contains all troubleshooting tools and use when we need to troubleshoot the application containers as above.


Hope this helps you in understanding Ephemeral Containers.

Read More

Kubernetes - Probes

Multiple parts of an application running in multiple containers are hard to manage. A big reason is that there are many moving parts of that application that all need to work for an application to function. If a small part breaks, the system has to detect, route it and fix it. All this needs to be done automatically.

Kubernetes provides us Health Checks to let a system know if the app is working or not. It should also make sure that if the app is not working, the requests should be routed and also the system should bring the application back to a healthy state.

Kubernetes provides us with 3 types of probes
Liveness Probe
Readiness Probe
Startup probe

Liveness probe : This indicates whether the container is running or not. This means to check if the application is up and running inside the container. If this probe fails, the kubelet will kill the pod as defined by its restart policy. If the pod is not defined with the liveness probe, the default is success.

Imagine a case where the application running inside the container has a deadlock. The app is hung at this moment but since the process is running, the requests are sent to this pod. This is where liveness probe comes into picture. K8s will hit the application as a part of liveness probe and based on the response the requests are sent. If the liveness probe fails the pod is restarted based on the restart policy that we define.the liveness probe looks as below,

[root@manja17-I13330 kubenetes-config]# cat liveness-pod.yml
apiVersion: v1
kind: Pod
metadata:
  name: testing-service
spec:
  containers:
    - name: test-ser
      image: docker.io/jagadesh1982/testing-service
      ports:
      - containerPort: 9876
      livenessProbe:
        initialDelaySeconds: 2
        periodSeconds: 5
        httpGet:
          path: /info
          port: 9876

Readiness Probe : This probe indicates if the container is ready to accept the request are not. This probe is designed to let kubernetes know whether the app is ready to serve the traffic or not. If the readiness probe fails, the endpoint controller removes the pods IP address from the endpoint of all services that match the pod. Kubernetes makes sure the readiness probe passes before allowing a service to send traffic to the pod. The default state of the readiness probe before the initial delay is Failure. If the container does not specify any readiness probe, the default statue is Success. A simple readiness probe looks as below,

[root@manja17-I13330 kubenetes-config]# cat readiness-pod.yml
apiVersion: v1
kind: Pod
metadata:
  name: testing-service
spec:
  containers:
    - name: test-ser
      image: docker.io/jagadesh1982/testing-service
      ports:
      - containerPort: 9876
      readinessProbe:
        initialDelaySeconds: 1
        periodSeconds: 5
        timeoutSeconds: 1
        successThreshold: 1
        failureThreshold: 1
        exec:
         command:
           - cat
           - /etc/nginx/nginx.conf

Startup probe : This indicates whether the application in the container is started or not. If the Startup probe is defined , all other probes are disabled until the startup probe is successful. If the probe fails, the kubelet will kill the container based on the restart policy. Consider legacy applications where they require some time to startup which means the boot time is more or it may be a case where the first time initialization is more. In these cases setting up the live probe can be hard based on the time. This is where startup probe helps. A simple startup probe looks as below,

[root@manja17-I13330 kubenetes-config]# cat startup-pod.yml
apiVersion: v1
kind: Pod
metadata:
  name: testing-service
spec:
  containers:
    - name: test-ser
      image: docker.io/jagadesh1982/testing-service
      ports:
      - containerPort: 9876
      startupProbe:
        httpGet:
         path: /info
          port: 9876
        failureThreshold: 30
        periodSeconds: 10
In the above code, the startup time is with failureThreshold * periodSeconds which means in the above case it is 30 * 10 = 300ms.

Hope this helps in understanding the Probes available in kubernetes.

Read More

Kubernetes - Restart Pods

There are many times where a developer needs to restart his application. When the application is deployed in a container/pod implementation like in kubernetes, the restart works in a different way. 


There are multiple ways to restart an application pod.

1.Use the deployment rollout restart command as below

[jagadishmanchala@Jagadish-theOne:k8s] kubectl get deploy

NAME                  READY   UP-TO-DATE   AVAILABLE   AGE

test-service-deploy   2/2     2            2           23m


Restart the deployment using below command,

[jagadishmanchala@Jagadish-theOne:k8s] kubectl rollout restart deployment test-service-deploy

deployment.apps/test-service-deploy restarted


Now we can see that the deployment is restarted 

[jagadishmanchala@Jagadish-theOne:k8s] kubectl get deploy

NAME                  READY   UP-TO-DATE   AVAILABLE   AGE

test-service-deploy   2/2     2            2           1m


2. Modify the Env Variables of a deployment as below,

[jagadishmanchala@Jagadish-theOne:k8s] kubectl set env deployment test-service-deploy DEPLOY_DATE="$(date)"

deployment.apps/test-service-deploy env updated


Set env sets up a change in env variables , and set the env variable DEPLOY_DATE to the latest timestamp for the deployment and causes the pod to restart


3. Scale Down or Up for the deployment

[jagadishmanchala@Jagadish-theOne:k8s] kubectl scale deployment test-service-deploy --replicas=0

deployment.apps/test-service-deploy scaled


[jagadishmanchala@Jagadish-theOne:k8s] kubectl scale deployment test-service-deploy --replicas=1

deployment.apps/test-service-deploy scaled


Note - We can’t just restart the pods alone, pods that are created as a part of deployment or replica set or replication controller can have the option to restart. 

Read More

Kubernetes - Mounting a Host Path On To Pod

We already know kubernetes provides us with multiple ways of saving data on the disk. We have seen volume types using emptyDir and memory. The other and most used volume type is the Hostpath. In this article we will see how we can use a host path on disk to mount on to the pod and save data from the pod to the host machine.

The Host path details are defined in the volumes and attached to the pod using the VolumeMounts. Check the below example,

[jagadishmanchala@Jagadish-theOne:k8s] cat hostpath-volume.yml 

apiVersion: v1

kind: Pod

metadata:

  name: myapp

spec:

  containers:

  - name: my-app

    image: nginx

    ports:

    - containerPort: 8080

    volumeMounts:

    - name: my-volume

      mountPath: /app

  volumes:

  - name: my-volume

    hostPath:

      path: /Volumes/Working/k8s/test


In the above code, we are using the hostpath /Volumes/Working/k8s/test directory on the host machine to be mounted to the container on /app location. The name of the mount is my-volume


Run the code to see if the pod is running as below,

[jagadishmanchala@Jagadish-theOne:k8s] kubectl get pods

NAME            READY   STATUS    RESTARTS   AGE

myapp           1/1     Running   0          30s


Login to the pod and create few files for testing as below,

[jagadishmanchala@Jagadish-theOne:k8s] kubectl exec myapp -c my-app -it -- bash

root@myapp:/# df -hT

Filesystem     Type           Size  Used Avail Use% Mounted on

overlay        overlay         59G  4.5G   51G   8% /

tmpfs          tmpfs           64M     0   64M   0% /dev

tmpfs          tmpfs          987M     0  987M   0% /sys/fs/cgroup

grpcfuse       fuse.grpcfuse   47G   33G   14G  71% /app

/dev/vda1      ext4            59G  4.5G   51G   8% /etc/hosts

shm            tmpfs           64M     0   64M   0% /dev/shm

tmpfs          tmpfs          987M   12K  987M   1% /run/secrets/kubernetes.io/serviceaccount

tmpfs          tmpfs          987M     0  987M   0% /sys/firmware

root@myapp:/# cd /app/

root@myapp:/app# touch hai hello

root@myapp:/app# exit

exit


Now check on the host path to confirm as below,

[jagadishmanchala@Jagadish-theOne:k8s] ll test/

total 0

-rw-r--r--  1 jagadishmanchala  staff  0 Dec 28 12:30 hai

-rw-r--r--  1 jagadishmanchala  staff  0 Dec 28 12:30 hello


Hope this helps in understanding the hostpath Volume.


Read More