Pages

Showing posts with label TroubleShooting. Show all posts

Friday, May 7, 2021

JIRA Cluster Replication Issue - Solved

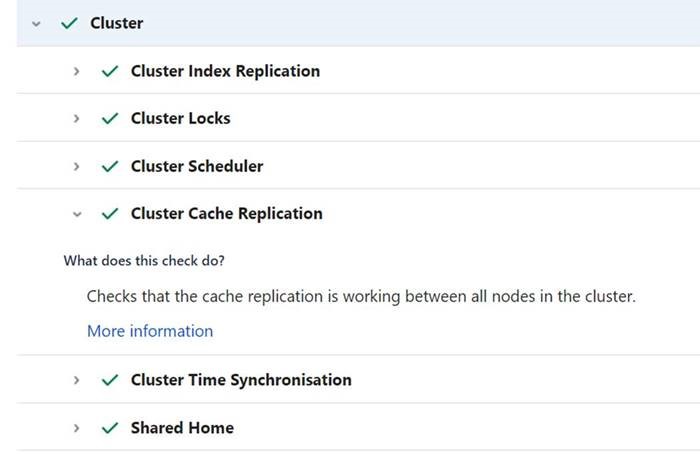
 As a part of onboarding Jira to our organization, we used JIRA Data Center edition with 4 nodes. Once the Cluster is configured and after attaching load  balancer to the cluster, we observed a warning on the console. We can see the Warning “Cluster Cache Replication Health” check failed.

Upon researching and doing a lot of trials, we were able to solve this issues. Here are few things to do if missing,

  1. Jira requires communication between the cluster nodes to communicate and replicate cache data. The cluster nodes talk to each other using TCP/IP communication on the Port 5071. So we have to open the 5701 port on all nodes by either opening the iptables or firewalld.

  2. Jira uses Ehcache as the cache technology.  We have to open the ports by which  the Ehcache cache replication happens. The ports include

Ehcache - 40001 - For inter node communication in Data Center

Ehcache - 40011 - set by default in JIRA 7.13 or higher


All these 3 ports need to be open in all nodes of the cluster.


  1. Opening these 3 ports does not work. We have to tell Jira to use these ports for the cluster communication and cache replication. For this we have to modify the cluster.properties files in all nodes with below content.


         [root@GLGBLN-ST931512 jira]# cat cluster.properties


          # This ID must be unique across the cluster

              jira.node.id = node-3


          # The location of the shared home directory for all Jira nodes

             jira.shared.home = /app/atlassian/application-data/shared


             ehcache.listener.port = 40001

             ehcache.object.port = 40011


  1. Even though the Ports are opened, we need to provide JIRA a reachable address of the nodes through which it can replicate Cache data. This is done by adding the ehcache.listner.hostname element to the cluster.properties as below

         ehcache.listener.hostName = 10.186.45.110

  So now the whole contents of the cluster.properties look as below

[root@GLGBLN-ST931512 jira]# cat cluster.properties

# This ID must be unique across the cluster

jira.node.id = node-3

# The location of the shared home directory for all Jira nodes

jira.shared.home = /app/atlassian/application-data/shared 

ehcache.listener.hostName = 10.186.45.110

ehcache.listener.port = 40001

ehcache.object.port = 40011


Upon adding everything it did not went well, still we are seeing the Cache Replication Exception and also UnknownHost Exception. Then i made 2 more changes as below,Added the hostname to /etc/hosts file 

[root@GLGBLN-ST931512 log]# cat /etc/hosts

127.0.0.1   localhost localhost.localdomain localhost4 localhost4.localdomain4

#::1     localhost localhost.localdomain localhost6 localhost6.localdomain6

10.186.45.110 localhost localhost.localdomain GLGBLN-ST931512.eu.novartis.net 

We added the local machine IP address along with FQDN. 

Next made changes to the cluster.properties as below,

[root@GLGBLN-ST931512 jira]# cat cluster.properties

# This ID must be unique across the cluster

jira.node.id = node-3

# The location of the shared home directory for all Jira nodes

jira.shared.home = /app/atlassian/application-data/shared

ehcache.listener.hostName = GLGBLN-ST931512.eu.novartis.net

ehcache.listener.port = 40001

ehcache.object.port = 40011 

Made sure the FQDN is added to the cluster.properties file. By this the Cluster Cache replication issue solved,

Read More

Wednesday, November 27, 2013

Wire Shark : Packet Capturing Tool

Wire-shark is a network analysis tool which captures network packets in real time. They are captured in human readable format. The tool is formally called as Ethereal.

Wire-shark includes filters, color indicators and many other features that lets admin to dig into the network traffic and see what’s going on

This article is a brief introduction of how wire-shark is installed and how one can use to dig the network details.

1. Install the package.
In order to install the Wire-shark package, go to http://www.wireshark.org/download.html  

Select the Correct packages for the installation. I will be explaining how to build the wire-shark in Red hat Linux 6.

Download the Source Code and unzip it a location and execute
yum install bison flex gtk2-devel libpcap-devel c-ares-devel libsmi-devel gnutls-devel libgcrypt-devel krb5-devel GeoIP-devel ortp-devel portaudio-devel*

Linux then tries to install the packages which are dependent for wire-shark

2.Once the packages are installed ,run the following commands
cd wireshark-1.8.11
./autogen.sh
 ./configure --enable-setcap-install
 make
 make install
 wireshark &

If everything goes fine, we can now see the Wire-shark console on the screen.


3. Start Using Wire-Shark

 We can see the Interfaces that are available in our system under the Interface list. Under the Start
Click on the Interface, in this case consider “eth0”.Once we click the interface it starts capturing packets on that interface.

As soon as you click the interface’s name, you’ll see the packets start to appear in real time. Wireshark captures each packet sent to or from your system. It captures all sorts of packets on tcp,udp,http and many more.


Click the stop capture button near the top left corner of the window when you want to stop capturing traffic.

Wire-shark follows colors to represent different information from the above screen. We can see packets highlighted in green, blue and black. Wire-shark uses colors to help you identify the types of traffic at a glance. By default, green is TCP traffic, dark blue is DNS traffic, light blue is UDP traffic and black identifies TCP packets with problems — for example, they could have been delivered out-of-order.

Wire-shark can also allow us to filter packet information based on criteria. We can use the filter option available on the top to select the packet information like


Wire-shark also provides options to select filter. Click on the Analyze menu and select Display Filters to create a new filter.Select the Filter you want to analyze packet information for.


Another important feature with wire-shark is that it allows you to follow the Packet Stream.
Just right click on a packet and select “Follow TCP Stream” or “Follow UDP Stream”. We can get more information like the full conversation between Client and Server in this request.


Close the window and you’ll find a filter has been applied automatically — Wire shark is showing you the packets that make up the conversation.

We can also inspect packet information by just right clicking on the packet and selecting “view its Details”.

This article is basically an introduction for wire shark.I will be providing more details on the usage of this tool

Happy learning, more To Come J
Read More

Wednesday, September 11, 2013

The Top Stuff

Displaying top CPU_consuming processes
ps aux | head -1; ps aux | sort -rn +2 | head -10

Displaying top 10 memory-consuming processes
ps aux | head -1; ps aux | sort -rn +3 | head

Displaying process in order of being penalized
ps -eakl | head -1; ps -eakl | sort -rn +5

Displaying process in order of priority
ps -eakl | sort -n +6 | head

Displaying process in order of nice value
ps -eakl | sort -n +7

Displaying the process in order of time
ps vx | head -1;ps vx | grep -v PID | sort -rn +3 | head -10

Displaying the process in order of real memory use
ps vx | head -1; ps vx | grep -v PID | sort -rn +6 | head -10

Displaying the process in order of I/O
ps vx | head -1; ps vx | grep -v PID | sort -rn +4 | head -10

Displaying WLM classes
ps -a -o pid, user, class, pcpu, pmem, args

Determinimg process ID of wait processes
ps vg | head -1; ps vg | grep -w wait

Wait process bound to CPU
ps -mo THREAD -p

Find Out The Top 10 Memory Consuming Process
ps -auxf | sort -nr -k 4 | head -10

Find Out top 10 CPU Consuming Process
ps -auxf | sort -nr -k 3 | head -10

Biggest 10 Files
du -sh * | sort -n | tail
du -x -a . | sort -n -r | head -n 10

List All the Process By memory usage
ps -e -orss=,args= | sort -b -k1,1n | pr -TW$COLUMNS
ps -eo pcpu,pid,user,args | sort -k 1 -r | head -10
ps -eo pcpu,pid,user,args | sort -r -k1 | less

Highest CPU Usage
ps -eo pcpu,pid,user,args | sort -k 1 -r | head -10 | awk "{ print $2 }"

Total Memory Usage
sar -q 1 | tail -1 | awk '{ print "" $3}' | sed 's/%//g'

CPU Threshold
top -b -n 1 | awk -F'[:,]' '/^Cpu/{sub("\\..*","",$2); print $2}'

Process Using memory
ps aux | awk '{if ($5 != 0 ) print $2,$5,$6,$11}' | sort -k2n

Largest File Or Directory
du -sk /var/log/* | sort -r -n | head -10

Processes Count Used By Users
ps hax -o user | sort | uniq -c

Memory Percentage Usage of a Process
ps -o comm,%mem,args PID

Top Files Using perl
du -k | sort -n | perl -ne 'if ( /^(\d+)\s+(.*$)/){$l=log($1+.1);$m=int($l/log(1024)); printf ("%6.1f\t%s\t%25s %s\n",($1/(2**(10*$m))),(("K","M","G","T","P")[$m]),"*"x (1.5*$l),$2);}'

Top File Users
for x in `ps -eF| awk '{ print $2 }'`;do echo `ls /proc/$x/fd 2> /dev/null | wc -l` $x `cat /proc/$x/cmdline 2> /dev/null`;done | sort -n -r | head -n 20
Read More

Resource Management : MTR

mtr ( Matt’s Trace route) is powerfull network diagnostic tool that provides various options including allowing administrators to monitor and diagnose various network issues. It also allows us to provide various network related reports.

In this article , we will see some of the basic uses of the mtr command.

Network diagnostic tool like ping , trace route uses ICMP ( Internet control message Protocol ) packets. MTR combines the functions of both the standard programs ping and trace route. So when a user uses a ping to test whether the remote machine is up or not , a series of ICMP packets are sent to the remote host ( Much Like Ping ). The remote machine in return send the ICMP packets back again. The user's client is then able to compute the round trip time between two points on the Internet.

Tools such as trace route and MTR send ICMP packets with incrementally increasing TTLs in order to view the route or series of hops that the packet makes between the origin and its destination.

Like Trace Route , it sets the TTL( Time to Live ) or the number of maximum hops a packet can take over the network , to a low number, increasing with each attempt. The TTL, or time to live, controls how many "hops" a packet will make before "dying" and returning to the host.

MTR collects additional information regarding the state, connection, and responsiveness of the hosts. Because of this, it is recommended that you use MTR whenever possible to provide the most complete overview of the connection between two hosts on the Internet.

Analyze MTR Reports
Mtr reports can be a little complex to understand. Consider the example of connectivity to google.com.

The command is executed as “mtr –report www.google.com” which sends 10 packets to the host google.com and generates the output. Without the --report option, mtr will run continuously in an interactive environment.

​[root@vx111a Desktop]# mtr --report www.google.com
HOST: vx111a.jas.com              Loss%   Snt   Last    Avg    Best   Wrst   StDev
1. abs-static-225.131.102.118.a 0.0%    10      1.5     1.5    1.5       1.6     0.0
2. abs-cn-206.197.79.114.aircel 0.0%    10      16.8   17.0   16.8     17.8   0.3
3. 72.14.212.217                        0.0%    10      16.5    27.1  16.5    120.1 32.7
4. 72.14.233.204                        0.0%    10      16.6    16.6   16.6   16.7   0.1
5. 72.14.239.20                          0.0%   10       48.2    50.6  47.9   72.1   7.6
6. 72.14.233.79                          0.0%   10       48.3    48.4   48.1   49.4   0.4
7. sin04s01-in-f20.1e100.net       0.0%   10       49.1    49.1    49.1  49.2   0.0

Mtr some times takes a few more minutes to obtain the information. In this case there are 7 hops.
"Hops" are the nodes, or routers, on the Internet that packets transverse to get to their destination. The packet travels through the local network to the last network with a couple of hosts in between.

The columns include

The Loss% column shows the percentage of packet loss at each hop.
The Snt column counts the number of packets sent.

The --report option will send 10 packets unless specified with "--report-cycles=[number-of-packets]", where [number-of-packets] represents the total number of packets that you want to send to the remote host.

The next four columns Last, Avg, Best, and Wrst are all measurements of latency in milliseconds (e.g. ms).

Last is the latency of the last packet sent
Avg is average latency of all packets
Best and Wrst display the best (shortest) and worst (longest) round trip time for a packet to this host

The final column, StDev, provides the standard deviation of the latencies to each host

In most circumstances, you may think of the MTR output in three major sections. Depending on configurations, the first 2 or 3 hops often represent the source host's ISP, while the last 2 or 3 hops represent the destination host's ISP. The hops in between are the routers the packet traverses to reach its destination.

So if we are running the mtr from our local system , the first 2 or 3 hops belong to your ISP. The last 3 hops belong to the remote machine. Any hops in the middle are intermediate hops. if you see an abnormality in the first few hops near the source, contact your local admin or investigate your local networking configuration and , if you see abnormalities near the destination you may want to contact the network support for that remote machine . Unfortunately, in cases where there are problems on the intermediate hops, both service providers will have limited ability to address.

More to Come On how to analyze network Issue with the mtr command.
Keep learning :-)
Read More

Friday, August 30, 2013

Very use full Commands ( For Trouble Shooting )

Some of these Commands may be throw an error when I Use '-' ( hyphen ) ,so for commands using hyphen be a little cautious

Biggest 10 Files
du -sh * | sort -n | tail
du -x -a . | sort -n -r | head -n 10

List All the Process By memory usage
ps -e -orss=,args= | sort -b -k1,1n | pr -TW$COLUMNS
ps -eo pcpu,pid,user,args | sort -k 1 -r | head -10
ps -eo pcpu,pid,user,args | sort -r -k1 | less

find how many files an application is using
lsof +c 0 | cut -d' ' -f1 | sort | uniq –c

Highest CPU Usage
ps -eo pcpu,pid,user,args | sort -k 1 -r | head -10 | awk "{ print $2 }"

Total Memory Usage
sar -q 1 | tail -1 | awk '{ print "" $3}' | sed 's/%//g'

CPU Threshold
top -b -n 1 | awk -F'[:,]' '/^Cpu/{sub("\\..*","",$2); print $2}'

Current User With Session Count
who | awk '{ User [$1]++; } END { for (i in User) printf "%-9s %s\n", i, User [i] }'

Memory Details
free -t -m | grep "Total" | awk '{ print "Total Memory space : "$2 " MB";
print "Used Memory Space : "$3" MB";
print "Free Memory : "$4" MB";
}'

Swap memory Details
free -t -m | grep "Swap" | awk '{ print "Total Swap space : "$2 " MB";
print "Used Swap Space : "$3" MB";
print "Free Swap : "$4" MB";
}'

Process Using memory
ps aux | awk '{if ($5 != 0 ) print $2,$5,$6,$11}' | sort -k2n

Largest File Or Directory
du -sk /var/log/* | sort -r -n | head -10

Processes Count Used By Users
ps hax -o user | sort | uniq -c

Who Started this Process
ps -o comm= -p $(ps -o ppid= -p PID)

How Much Ram Is Being Used
ps -o rss -C java | tail -n +2 | (sed 's/^/x+=/'; echo x) | bc

When Was the Process Started
ps -o lstart PID

Environment Variables belong to a Process
ps ewwo command PID | tr ' ' '\n' | grep \=

List Threads by Pid along with Thread Start Time
ps -o pid,lwp,lstart --pid PID -L

CPU usage for EACH cores
ps ax -L -o pid,tid,psr,pcpu,args | sort -nr -k4| head -15 | cut -c 1-90

Memory Percentage Usage of a Process
ps -o comm,%mem,args PID

Total CPU Usage Percentage
ps aux | awk {'sum+=$3;print sum'} | tail -n 1

Find Class Files inSide the Jar Location
find . -iname '*.jar' -printf "unzip -c %p | grep -q 'sample Text' && echo %p\n" | sh

Find the Class File in jars
find . -name "*.jar" | while read line; do unzip -l $line; done | grep

Search The File From Multiple Jar Files
find . -name "*.jar" | xargs -tn1 jar tvf | grep --color "log4j.xml"

List of Files That Are Open For Writing to Disk
lsof | grep -e "[[:digit:]]\+w"

See which Process is Holding the File
lsof -r1 /common/jboss.log

List the files accessed by a program
strace -f -o foo.trace su user -c 'mycommand'?

get size of data that haven't been written to disk yet
The term for that is "dirty" data (data that has been changed, but not yet flushed to permanent storage).
cat /proc/meminfo | grep Dirty
Dirty : 188 kB

Owner of the File
/sbin/fuser admin.lok
admin.lok: 5912
Pmap Output In Kilo Bytes
pmap -x PID | awk '/\[ anon \]/ {total += $3} END {print total}'

determine which application is utilizing a certain port?
lsof -w -n -i tcp:80 ( or any Othe Port)
Start Number of active, and recently torn down TCP sessions
netstat -ant | egrep -i '(ESTABLISHED|WAIT|CLOSING)' | wc -l

Number of sessions waiting for ACK (SYN Flood)
netstat -ant | egrep -i '(SYN)' | wc -l
Find Network Connections
Out Going Going Connections
localhost:root002-~ $ lsof | grep omdx1971
java 1142 dwls977 924u IPv6 141719124 0t0 TCP localMachine :27710->eth0.remoteMachine.nova.com:54426 (ESTABLISHED)

java 1142 dwls977 925u IPv6 141713891 0t0 TCP localMachine :27710->eth0.remoteMachine.nova.com:54141 (ESTABLISHED)

Incoming Connections
Once you got the Out Going Connections , we can get the Port and try it on the local machine to find the connection information

remoteMachine:root002-~ $ netstat | grep 54426
tcp 0 0 localMachine :54426 eth0.remoteMachine.nova.co:27710 ESTABLISHED
All Outgoing Connections
netstat -an | grep -i tcp | grep ESTABLISHED | less
talk to Other over the Network
Dev:vx1379:djbs002-~ $ lsof -p 29118 -a -i ( Process Talk)
show the number of connections active to a port and also the number of connections from that ip in order
netstat -ntu | awk '{print $5}' | cut -d: -f1 | sort | uniq -c | sort -n
List listening TCP sockets
netstat -ant | egrep -i '(LISTEN)'
List Per User Process
ps -e -o uid,vsz | awk '{ usage[$1] += $2 } END { for (uid in usage) { print uid, ":", usage[uid] } }'
Working Directory of a Running process
lsof -bw -d cwd -a -c java
Extract files from war/Ear
jar xf abc.war log4j-test.xml WEB-INF/
All Connections from a Specific process
lsof -p PID -a -i
Scan a port On a Remote Machine
nc -v -w 1 -z
Show The Java Process
top -b -n 1|grep java|wc -l
Smallest To biggest
ls -s | sort -nr | more
Find Files That Exceed a Specified Size Limit
find . -size +400 -print
Grep All Files Of A Certain File Type For A Specific Pattern
find . -type f -name '*.cs' -print0 | xargs -0 grep --color=always -n PATTERN

Zero Length File Sizes
find . -type f -size 0k -exec rm {} \; | awk '{ print $8 }'
Find and Kill a Process
ps ux | grep | grep –v grep | awk ‘{print $2}’ | xargs –r kill -9
Files Opened By a Process
lsof +f | grep PID
Find The Command Line Of the Process Using Specific Port
cat /proc/$(lsof -ti:)/cmdline
All Open Tomcat Threads
ps -ALcf | grep org.apache.catalina.startup.Bootstrap | wc -l

Find The MAC Address
[root@vx111a test]# cat /sys/class/net/eth0/address

List all the Installed Perl packages
perl -MFile::Find=find -MFile::Spec::Functions -Tlwe 'find { wanted => sub { print canonpath $_ if /\.pm\z/ }, no_chdir => 1 }, @INC'
Find Whether a Port is Open On a Remote Machine
nmap -p
Status Of the HTTP
curl -o /dev/null --silent --head --write-out '%{http_code}\n'
200
-o /dev/null throws away the usual output
-silent throws away the progress meter
-head makes a HEAD HTTP request, instead of GET
-write-out '%{http_code}\n' prints the required status code
Find Whether The Process is 32Bit or 64Bit
file -L /proc/PID/exe

The Output would be some thing like this
/proc/6462/exe: ELF 32-bit LSB executable, Intel 80386, version 1 (SYSV), for GNU/Linux 2.2.5, dynamically linked (uses shared libs), not stripped
Convert Of Bytes to Mbs
units --terse "3415014314 bytes" "MB"

SSh and Execute a Command
ssh root@ -q 'echo $MYDIR’
Find out what is listening on a series of ports
/sbin/fuser -n tcp {7000..8000}
View details of network activity between
lsof -i :7000-8000
List all files opened by a particular command
lsof -c java
List Threads By PID along with Thread Start Time
ps -o lwp,lstart --pid PID

Count Threads OF a Process
ps uH -p PID | wc –l

Print a stack trace of a running process
Pstack PID
Return Number of kernel Threads Owned by a process
ps -o thcount –p PID
Show Ports that belong to this PID
netstat --all --program | grep PID

Drop all the Connections available now for a Port
iptables -I INPUT -p tcp -dport 80 -j DROP

Find and Grep a File
find $PWD -type f -exec egrep PAVAN {} \;

Find the Time took Process To Complete
/usr/bin/time -v

Memory Information ( Much Better than Free Command)
vmstat -s -S M
List all the Jars loaded by a Process
lsof -p PID | grep jar

All process Running as a Specific User
pgrep -l -f -x -u root
Find and Remove Files Matching a pattern
find $PWD -type f -name "*Jul-*.ESS-A1.log" -exec rm -f {} \;

Find and Zip files matching a Pattern
find $PWD –type f –name “ess_admin.controllermessages.log.” | xargs tar zcvf one.tar

How to list all unique ip address currently connected to a specific port
ss -o state established '( dport = :10012 )'|awk -F"[\t :]+" 'NR!=1{ ip[$5]+=1 } END{ for (i in ip){n++};print n }'

Find and Gzip
find $PWD –type f –name “*.log” | xargs tar zcvf one.tar

Find and Remove
find –type f –name “*.log” | xargs rm
find –type f –name “*.log” -exec rm -f {} \;

Find Files That are Updated in The Last 60 Minutes
find $PWD -mmin -60

Find all files Older than 2 days and gzip them
find $PWD -type f -mtime +2 | xargs gzip

How many Open Tomcat Threads
ps -ALcf | grep org.apache.catalina.startup.Bootstrap | wc -l

Differences between 2 files in remote hosts
diff <(ssh alice cat /etc/apt/sources.list) <(ssh bob cat /etc/apt/sources.list)

Monitor the active thread count of a process (jvm) on linux
ps uH -p 10343 | wc -l

How do I find out which service is listening on a specific port?
lsof -Pnl +M -i4 ( IP 4 )
lsof -Pnl +M -i6 ( IP 6 )
netstat -npl

Display CPU,Memory Usages of the Users
ps axo user,pcpu,pmem,rss --no-heading | awk '{pCPU[$1]+=$2; pMEM[$1]+=$3; sRSS[$1]+=$4} END {for (user in pCPU) if (pCPU[user]>0 || sRSS[user]>10240) printf "%s:@%.1f%% of total CPU,@%.1f%% of total MEM@(%.2f GiB used)\n", user, pCPU[user], pMEM[user], sRSS[user]/1024/1024}' | column -ts@ | sort -rnk2
Kill a Process on the Port
kill -9 `lsof -t -i :port_number`
How Many Established Connection
lsof | grep -c "(ESTABLISHED)"
How to enlarge existing file to specific size
dd if=/dev/zero bs=1 seek=new_filesize count=0 of=your_file
For example this:
dd if=/dev/zero bs=1G seek=1000 count=0 of=test
will enlarge file test to 1000G
Tail the Last Bytes of Files
tail -c 400 jboss.log > jboss.log11
Deleted Files along with File Descriptor(FD)
lsof | awk '(/deleted/) {print "FD :-",$4,"| File Name:-",$9}'
Check the Files For Changes From the last 1 Hour
awk -vDate=`date -d'now-1 hours' +[%d/%b/%Y:%H:%M:%S` ' { if ($4 > Date) print Date FS $4}'
Threads in a Process
ps -eLo pid,ppid,tid,pcpu,comm | grep PID
Grep Multiple Words
grep -w 'warning\|error\|critical' /var/log/messages
Find Out What Partition a File Belongs To
We can use the df command to find out what partition a file belongs,

[root@vx111a perl]# df -T file1
Filesystem Type 1K-blocks Used Available Use% Mounted on
/dev/sda7 ext3 49594196 5499736 41534504 12% /soa
Find Out Port
/sbin/fuser 10011/tcp
10011/tcp: 32506

lsof -i tcp:10012
COMMAND PID USER FD TYPE DEVICE SIZE/OFF NODE NAME
java 32506 jbs002 67u IPv6 20552857 0t0 TCP *:10012 (LISTEN)
Thread Ids of a process in Linux using Proc
cat /proc/PID/task

How To Find The Number Of Open Files for a Process Name and process pid sorted by number of open files.?
lsof | perl -lane '$x{"$F[0]:$F[1]"}++;END { print "$x{$_}\t$_" for sort {$x{$a}<=>$x{$b}} keys %x}'
To show connections to a specific host
lsof -i@192.168.1.5

Show connections based on the host and the port using @host:port 

Grep All Files Of A Certain File Type For A Specific Pattern
find . -type f -name '*.*' -print0 | xargs -0 grep --color=always -n GCMonitor

Top 20 Process With High File Descriptors
for x in `ps -eF| awk '{ print $2 }'`;do echo `ls /proc/$x/fd 2> /dev/null | wc -l` $x `cat /proc/$x/cmdline 2> /dev/null`;done | sort -n -r | head -n 20

Ping a URL to Find the HTTP Status
Dev:Hunter@root-~ $ printf "GET / HTTP/1.0\r\nvx111a: www\r\n\r\n" | nc vx111a 10011 | head
HTTP/1.1 200 OK
Server: Apache-Coyote/1.1
Set-Cookie: JSESSIONID=291DBACCB3596F4FBC38ABFBDE99AA7C.jasB2; Path=/
ETag: W/"7857-1235874240000"
Last-Modified: Sun, 01 Mar 2009 02:24:00 GMT
Content-Type: text/html
Content-Length: 7857
Date: Thu, 10 Oct 2013 02:33:39 GMT
Connection: close

Dev:Hunter@root-~ $ nc -zw2 vx111a 10011 || echo http service is down
Connection to vx111a 10011 port [tcp/*] succeeded!

Dev:Hunter@root-~ $ curl -sL -w "%{http_code}\\n" "http://vx111a:10011/wls_monitor/" -o /dev/null
200

Redirect and Print
Dev:vx111a:jbs002-~ $ jmap -heap 922 2>/dev/null | grep MaxPermSize | awk '{print $3}'
268435456

The 2>/dev/null at the end of the find command tells your shell to redirect the error messages (FD #2) to /dev/null, so you don't have to see them on screen. Use /dev/null to to send any unwanted output from program/command. All data written on a /dev/null special file is discarded by the system. To redirect standard error to /dev/null and store file list to output.txt, type:

Find Who is Using Port
Dev:vx111a:djbs002-~ $ /sbin/fuser 10011/tcp
10011/tcp: 32506

Dev:vx111a:djbs002-~ $ lsof -i tcp:10012
COMMAND PID USER FD TYPE DEVICE SIZE/OFF NODE NAME
java 32506 djbs002 67u IPv6 20552857 0t0 TCP *:10012 (LISTEN)

Search For Out Of memory
find . -type f -exec grep -l java.lang.OutOfMemoryError {} \;
./MANDY-B1_gc.log
./heap.log
./MANDY -B1.log.yyyyMMdd_HHmmss

Conenct to the Linux Machine From windows Machine to Download Files
pscp -i C:\Ateam_uberkey.ppk jbs002@vx111a:/tmp/top.log C:\Users\Jag\Desktop\temp\top.log

Note : pscp is available with putty Software which is free to download


Obtain the Number of Thread States in a Thread Dump
dev:vx1abc:he002:nc-Dumps $ awk '/State: / { print }' < td.log.073716.013908855 | sort | uniq -c
   10    java.lang.Thread.State: RUNNABLE
    8    java.lang.Thread.State: TIMED_WAITING (on object monitor)
    2    java.lang.Thread.State: TIMED_WAITING (sleeping)
    2    java.lang.Thread.State: WAITING (on object monitor)
   24    java.lang.Thread.State: WAITING (parking)

Obtain the Count of Threads based on Thread State
dev:vx1cea:djhe002:nc-stackDetils $ awk '/State: TIMED_WAITING/ { getline; print }' < td.2013-10-17-03.log | sort | uniq -c
   50         at java.lang.Object.wait(Native Method)
   15         at java.lang.Thread.sleep(Native Method)
    5         at sun.misc.Unsafe.park(Native Method)

Grep Multiple Strings 
grep 'RUNNABLE\|ListenPort\|port\|clusters\|broadcastchannel\|multicastaddress\|multicastport\|server_cluster'  td.log.073652.957462762

Number of Connection Hits in between
Dev:vx1322:jbs002-JAS-A2 $ egrep "2013-08-09 16:47:12|2013-08-09 16:50:00" jboss.log  | wc -l
3

How many Requests Happened Per Minutes
egrep "17/Aug/2013:01|17/Aug/2013:02" PHYRES-H1_access.log | cut -d[ -f2 | cut -d] -f1 | awk -F: '{print $2":"$3}' | sort -nk1 -nk2 | uniq -c | sed 's/[ ]*//'

Query packages
dev:vx1abc:he002:nc-~ $ rpm -q --queryformat '\n%{NAME} %{VERSION} %{RELEASE} %{ARCH}\n' glibc
glibc 2.12 1.80.el6_3.6 x86_64
glibc 2.12 1.80.el6_3.6 i686

Processor and Memory Usage Per User
ps axo user,pcpu,pmem,rss --no-heading | awk '{pCPU[$1]+=$2; pMEM[$1]+=$3; sRSS[$1]+=$4} END {for (user in pCPU) if (pCPU[user]>0 || sRSS[user]>10240) printf "%s:@%.1f%% of total CPU,@%.1f%% of total MEM@(%.2f GiB used)\n", user, pCPU[user], pMEM[user], sRSS[user]/1024/1024}' | column -ts@ | sort -rnk2

Read More