Pages

Thursday, April 26, 2018

Installing & running Prometheus

Prometheus is a powerful , open source monitoring system that collect metrics from your services and stores them in a time series database.
It provides a query language , data model and when combined with visualization tools like grafana it provides more details.
Prometheus by default only exports metrics about it self like the memory consumption etc. But it also provides expansion by installing exporters which are generally optional programs that generate additional metrics.
Exporters provides information ranging from infra to databases and from web servers to message systems , API’s and more.
Some of the most popular exporters include:
node_exporter - This produces metrics about infrastructure, including the current CPU, memory and disk usage, as well as I/O and network statistics, such as the number of bytes read from a disk or a server's average load.
blackbox_exporter - This generates metrics derived from probing protocols like HTTP and HTTPS to determine endpoint availability, response time, and more.
nginx-vts-exporter - This provides metrics about an Nginx web server using the Nginx VTS module, including the number of open connections, the number of sent responses (grouped by response codes), and the total size of sent or received requests in bytes.

In this article we will see how we can install and configure Prometheus tool.
1. Create prometheus user with no home and no shell for our installation purpose
    sudo useradd --no-create-home --shell /bin/false prometheus

2. Configure the location where you want to save the prometheus data.
    Mkdir /etc/prometheus   - For config files
    Mkdir /var/lib/prometheus  - For data

3. Set the ownership on the above locations for prometheus user
   chown prometheus:prometheus /etc/prometheus
  chown prometheus:prometheus /var/lib/prometheus
4. Now once the prerequisites are done, we will be download the prometheus and install
Wget 
https://github.com/prometheus/prometheus/releases/download/v2.2.1/
prometheus-2.2.1.linux-amd64.tar.gz
5. Untar the file to see that we have 2 binary files (prometheus and promtool ), consoles and console_libraraies directories container web interface files and some other files like examples , notice etc
6. Execute the below commands for copying binary files to /usr/local/bin location and console files. Also to change the permission on the copied files
cp prometheus/prometheus /usr/local/bin/
cp prometheus/promtool /usr/local/bin/
chown prometheus:prometheus /usr/local/bin/prometheus
chown prometheus:prometheus /usr/local/bin/promtool
cp -r prometheus/consoles /etc/prometheus
cp -r prometheus/console_libraries /etc/prometheus
chown -R prometheus:prometheus /etc/prometheus/consoles
chown -R prometheus:prometheus /etc/prometheus/console_libraries
7.  Create a basic config prometheus file at /etc/prometheus
[root@root] cat /etc/prometheus/prometheus.yml
global:
  scrape_interval: 15s
scrape_configs:
  - job_name: 'prometheus'
    scrape_interval: 5s
    static_configs:
      - targets: ['localhost:9090']
  - job_name: 'node_exporter'
    scrape_interval: 5s
    static_configs:
      - targets: ['localhost:9100']
The configuration file is written in the yml format. The major configuration will be defined under the global element.
This scrape_interval value tells Prometheus to collect metrics from its exporters every 15 seconds, which is long enough for most exporters.
Once the scrape interval are defined we can then configure our node exporters.
By default prometheus gather all details about it self. You can also see i configured node exporter too. Please check this link for configuring node exporter.
We can understand the other elements. Job name is used to know the type of exporter we are using , static config and target as used to define where these exporters are running.
8. Change the permission on this file
    chown prometheus:prometheus /etc/prometheus/prometheus.yml
9. Run the prometheus using the command,
   prometheus /usr/local/bin/prometheus
    --config.file   /etc/prometheus/prometheus.yml
    --storage.tsdb.path /var/lib/prometheus/  
    --web.console.templates=/etc/prometheus/consoles
    --web.console.libraries=/etc/prometheus/console_libraries
10. Check the status if the server is running.
11. Access the application using “http://<IP address>:9090/”. You will be seeing some screen like this
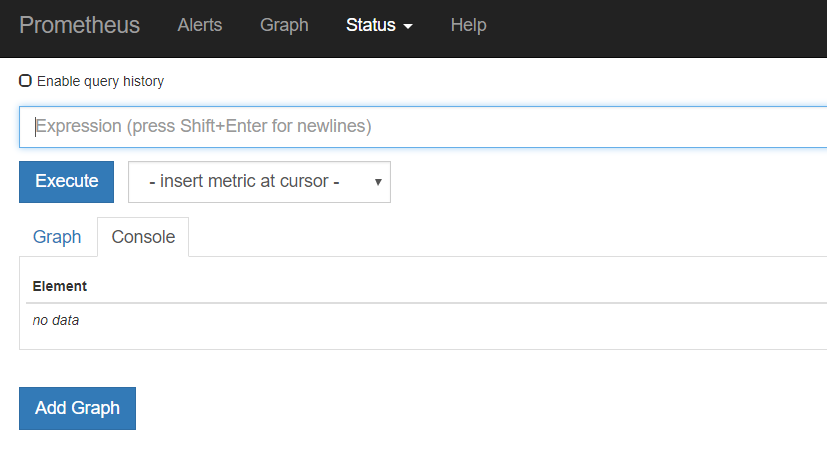
This is how you will be installing Prometheus tool and we will see more of this tool. More to Come ,Happy Learning :-)
Read More

Node_exporter in grafana

In order to export node exporter dashboard in grafana , follow the below steps

Click the “+” icon on the left in gradana to see an Import option.

Click on the import and in the text box under “grafana.com Dashboard” , past the “1860” . this value belong to the node exporter dashboard which is available in the grafana sites to import

Once you enter the value, it will take a few seconds and will give the below screen,

Select the Prometheus dashboard in the option box given and import
We will see a new node_exporter Dashboard in the main page.
This is how we will be importing Dashboards into grafana
Read More

Node_exporter with prometheus

Node_exporter is a hardware and machine metric collection and exporter to prometheus. The node exporter allows you to measure various machine resources such as memory, disk and CPU utilization. In this article we will see how we can configure node_exporter and export the machine and hardware metrics to prometheus
  1. Create a user node_exporter with no home
           useradd --no-create-home --shell /bin/false node_exporter
      2.  Download the node_exporter using wget
           wget https://github.com/prometheus/node_exporter/releases/download/
                     v0.16.0-rc.1/node_exporter-0.16.0-rc.1.linux-amd64.tar.gz
      3.  tar xvf node_exporter-0.16.0-rc.1.linux-amd64.tar.gz
      4. cp node_exporter-0.15.1.linux-amd64/node_exporter /usr/local/bin
      5. mv node_exporter-0.16.0-rc.1.linux-amd64 node_exporter
      6. cp node_exporter/node_exporter /usr/local/bin
      7.  chown node_exporter:node_exporter /usr/local/bin/node_exporter
      8. vi /etc/systemd/system/node_exporter.service
         Copy the below content,
     
           [Unit]
Description=Node Exporter
Wants=network-online.target
After=network-online.target
[Service]
User=node_exporter
Group=node_exporter
Type=simple
ExecStart=/usr/local/bin/node_exporter
[Install]
WantedBy=multi-user.target
  9 . systemctl start node_exporter
  10. systemctl start node_exporter
  11. systemctl enable node_exporter
Check the status to see if node_exporter is running.
Read More

Integrate Prometheus with Grafana

  1. 1. Make sure your prometheus is running
  2. 2. Make sure your grafana is running
  3. 3. Login into grafana using the “admin/admin” credentials.
  4. 4. Click on the Configuration -> Data source
     
        5. In the Add data source , fill the details like below
     
    Make sure you enter the correct link where your prometheus server is running

6. Click the Save and Test to make sure the connection between prometheus

    and grafana is working.
7. Click the Dashboard tab and see the available dashboards and click import.
8. Click Home and we can see all the dashboards that are imported now including Prometheus like below 
   

Read More

Grafana Installation

Grafana is a leading graph and dashboard builder for visualizing time series infrastructure and application metrics. This also provides a elegant way to create,explore and share dashboards ,data with other teams. In this article we will see how we can install grafana server
Installing grafana is quite straight ward. All we have to do is to add a Repo and run the “yum install grafana-server” command.
  1. Create a yum grafana.repo  file under “/etc/yum.repos.d/” and add the below contents to the file
         [grafana]
name=grafana
repo_gpgcheck=1
enabled=1
gpgcheck=1
gpgkey=https://packagecloud.io/gpg.key       https://grafanarel.s3.amazonaws.com/RPM-GPG-KEY-grafana
sslverify=1
sslcacert=/etc/pki/tls/certs/ca-bundle.crt
2. Install grafana
    Yum install grafana
3. Reload the daemons and start the grafana server
   Systemctl daemon-reload
   Systemctl start grafane-server
4. Enable the grafana server to get that started by systemctl command
    Systemctl enable grafane-server
Access the grafana Server using the “http://<IP address>:3000/”. The default credentials are “admin/admin”.
Read More

Wednesday, April 25, 2018

Kubernetes - Core Components


Kubernetes Components - As we already know k8 is a combination of multiple components. The description of the Kubernetes components below breaks them into these three groupings. The components that run on master nodes, the components that run on all nodes and the components that run scheduled onto the cluster.

The major components include,

Master Node or control plane - Etcd , Api Server , Scheduler  , Container runtime and Controller
Worker Node - Pods , Kubelet , Kube-proxy , Container runtime and CNI Implemented Network like flannel,Weave etc,  Image Registry
AddOns Components

The Architecture of kubernetes looks,
With multiple components in K8, it can be hard on how they talk to each other. In this article we will see what each component does in detail and also see how they talk to each other.

Every Component in K8 talks to Api Server. No Component talks to the Etcd other than Api Server. All Communication from Control Plane to worker nodes will happen only from Api Server. The communication between each component happens by a Rest based calls.

Before going in deep understanding of the components, let's get the status of the components running,

[root@manja17-I13330 kubenetes-config]# kubectl get po -o custom-columns=POD:metadata.name,NODE:spec.nodeName --sort-by spec.nodeName -n kube-system
POD                                                                  NODE
kubernetes-dashboard-7d5dcdb6d9-s967p           manja17-i13330
weave-net-rz5bh                                               manja17-i13330
kube-apiserver-manja17-i13330                         manja17-i13330
kube-controller-manager-manja17-i13330           manja17-i13330
kube-scheduler-manja17-i13330                         manja17-i13330
kube-proxy-dcnmw                                            manja17-i13330
etcd-manja17-i13330                                        manja17-i13330
kube-proxy-js69w                                             manja17-i14021
weave-net-255pb                                              manja17-i14021
kube-proxy-ww4s5                                            manja17-i14022
kube-dns-86f4d74b45-fvrtb                                manja17-i14022
heapster-5b748fbdc5-cxtsq                                manja17-i14022
weave-net-w582l                                               manja17-i14022

Note - All the components of K8 run under the  Kube-system name space. In the above
Manja17-i13330 is master
Manja17-i14021 and manja17-i14022 are nodes

Let’s  see the status of the components using,
[root@manja17-I13330 ~]# kubectl get componentstatuses
NAME                       STATUS    MESSAGE              ERROR
scheduler                 Healthy     ok
controller-manager   Healthy     ok
etcd-0                      Healthy    {"health": "true"}

Let’s start digging the Components,
ETCD - etcd is a distributed key-value store written in golang that provides a way to store data across a cluster of machines. The name “etcd’ originated from 2 parts, the unix “/etc” location storing configuration data for a single system and “d”istributed systems.
Etc is for storing configuration data for a single machine where as etcd is for storing configuration data that belong to the distributed systems.
Kubernetes stores configuration data into etcd for service discovery and cluster management; etcd's consistency is crucial for correctly scheduling and operating services. The Kubernetes API server persists cluster state into etcd. It uses etcd's watch API to monitor the cluster and roll out critical configuration changes.
kube-apiserver - Kube-apiserver is the very core component of the kubernetes. This is the front end for kubernetes exposing the kube api.
                                  
When you try to create a pod or deployment using the kubectl command , the kubectl command makes a call to the kube-apiserver with details. kube-apiserver then check who you are and also make sure your access level in the current namespace.
kube-apiserver also make sure to check the validity of the manifest file ( kubectl apply -f pod.yml) and if everything is fine , this will then write that to the etcd server.
kube-apiserver is the only one who can talk to the etcd server. Other Kubernetes components watch certain API endpoints that are relevant to them, based on endpoint they act accordingly. No other component can talk to the etcd , they have to talk using HTTP connections to the kube-apiserver.  

kube-scheduler - Component is responsible for scheduling pods on nodes. When we try to create a Pod, the scheduler assigns a node to the pod using information available. The information includes available resources, restrictions like quality of services , affinity rules, data locality , hardware & software and policy constraints.
The same can be done by a kubernetes admin who can enforce node selection to a pod using the NodeSelectors which determine which node a Pod should run. We can write our own Scheduler algorithm if the default one does not work.
kube-controller-manager - The kube-controller-manager is a daemon process container multiple controller. All these controllers are shipped in a single binary in kubernetes.
All that controller does is watch for events. The controller watch the events by watching some API endpoints from kube-apiserver. A controller watches the shared state of the cluster through kube-apiserver and makes changes attempting to move the cluster current state to the desired state.
a few examples of the controllers are deployment controller, node controller, job controller and namespace controller etc.
A Node controller watchs for all node status if they are up or down. a Daemon set controller watchs for the DaemonSet configuration and will create pod on every machine with that pod configuration.

Read More

Kubernetes - Worker Node Configuration

                                         
Set the Hostname for the worker node as ‘k8s-master’  
hostnamectl set-hostname ‘k8s-node’
Disable Selinux
setenforce 0
sed -i --follow-symlinks 's/SELINUX=enforcing/SELINUX=disabled/g' /etc/sysconfig/selinux
Configure the Firewall rules
firewall-cmd --permanent --add-port=10250/tcp
firewall-cmd --permanent --add-port=10255/tcp
firewall-cmd --permanent --add-port=30000-32767/tcp
firewall-cmd --permanent --add-port=6783/tcp
firewall-cmd  --reload
Set the bridge-nf-call-iptables to 1
modprobe br_netfilter
echo "1" > /proc/sys/net/bridge/bridge-nf-call-iptables
Configure the Kubernetes Yum Repo
Create a kubernetes.repo  file under /etc/yum.repos.d/ with the below contents,
[kubernetes]
name=Kubernetes
baseurl=https://packages.cloud.google.com/yum/repos/kubernetes-el7-x86_64
enabled=1
gpgcheck=1
repo_gpgcheck=1
gpgkey=https://packages.cloud.google.com/yum/doc/yum-key.gpg
       https://packages.cloud.google.com/yum/doc/rpm-package-key.gpg


Disable the Swap
run the command , swapoff -a

Install , Enable & Start Docker and kubeadm
yum install kubeadm docker -y
systemctl restart docker && systemctl enable docker
systemctl  restart kubelet && systemctl enable kubelet
Join the worker Node with master
Join the worker node to the master node by running the below command ,
kubeadm join 10.131.175.138:6443 --token pe7y1r.zk9u6c07g2nlwm3h --discovery-token-ca-cert-hash sha256:48dfb2c9eda08aaed84a70011221804c80adcd700e73d870fd12d041b0054641
This command is available in the output of the “kubeadm init” command in the master node.
We can see that the node has joined the master successfully.
Check the node status using the “kubectl” command as,
As we can see the master and node are connected.

Read More

Kubernetes - Master Node Configuration


We will be creating a 2 node kubernetes cluster in which we have a master and a node.The Machine details include

10.131.175.138    -  Master Node 
172.16.202.96      -  Worker Node

Configuration on Master Node 
Set the Hostname for the master node as ‘k8s-master’  
hostnamectl set-hostname ‘k8s-master’

Disable Selinux
setenforce 0
sed -i --follow-symlinks 's/SELINUX=enforcing/SELINUX=disabled/g' /etc/sysconfig/selinux

Configure the Firewall rules
firewall-cmd --permanent --add-port=6443/tcp
firewall-cmd --permanent --add-port=2379-2380/tcp
firewall-cmd --permanent --add-port=10250/tcp
firewall-cmd --permanent --add-port=10251/tcp
firewall-cmd --permanent --add-port=10252/tcp
firewall-cmd --permanent --add-port=10255/tcp
firewall-cmd --reload

Set the bridge-nf-call-iptables to 1
modprobe br_netfilter
echo "1" > /proc/sys/net/bridge/bridge-nf-call-iptables
These control whether or not packets traversing the bridge are sent to iptables for processing

Disable the Swap
use the command , swapoff -a
Why are we disabling swap? Swapping results in moving data to and fro from memory. The idea
of kubernetes is that all deployments should be pinned with the actual memory/Cpu limits.
Swapping a pod details can result in slowness.

Configure the Kubernetes Yum Repo
Create a kubernetes.repo  file under /etc/yum.repos.d/ with the below contents,
[kubernetes]
name=Kubernetes
baseurl=https://packages.cloud.google.com/yum/repos/kubernetes-el7-x86_64
enabled=1
gpgcheck=1
repo_gpgcheck=1
gpgkey=https://packages.cloud.google.com/yum/doc/yum-key.gpg
       https://packages.cloud.google.com/yum/doc/rpm-package-key.gpg

Install , Enable & Start Docker and kubeadm
yum install kubeadm docker -y
systemctl restart docker && systemctl enable docker
systemctl  restart kubelet && systemctl enable kubelet
Initialize the Kubernetes Master by kubeadm
Run the “kubeadm init” command to initialize the kubernetes master , if all goes well will be seeing an output similar to the below

Your Kubernetes master has initialized successfully!

To start using your cluster, you need to run the following as a regular user:

  mkdir -p $HOME/.kube
  sudo cp -i /etc/kubernetes/admin.conf $HOME/.kube/config
  sudo chown $(id -u):$(id -g) $HOME/.kube/config

You should now deploy a pod network to the cluster.
Run "kubectl apply -f [podnetwork].yaml" with one of the options listed at:
  https://kubernetes.io/docs/concepts/cluster-administration/addons/

You can now join any number of machines by running the following on each node
as root:

  kubeadm join 10.131.175.138:6443 --token pe7y1r.zk9u6c07g2nlwm3h --discovery-token-ca-cert-hash sha256:48dfb2c9eda08aaed84a70011221804c80adcd700e73d870fd12d041b0054641

Save the contents of this output since we will be using in connecting the worker nodes with the master node.

Configure the cluster to use as Root user
Once the master is up and running , we then need to configure our cluster to be used by root user. Execute the commands ,

mkdir -p $HOME/.kube
cp -i /etc/kubernetes/admin.conf $HOME/.kube/config
chown $(id -u):$(id -g) $HOME/.kube/config

Once the commands are executed , get the pod list using the Kubectl command as,
We will be seeing all pods running in the current cluster. Once Pod “dns” is still in pending. 
If we get the node list even, we see that the master is still in “NotReady” state. We need to get the Master to ready state and also the dns pod to running state. We need to deploy the pod network so that containers in other hosts communicate with each other. POD network is the overlay network between worker nodes.

Note - An overlay network is a telecommunications network that is built on top of another network and is supported by its infrastructure. An overlay network decouples network services from the underlying infrastructure by encapsulating one packet inside of another packet.

The network must be deployed before any application. Kube-dns is a internal helper service will not startup before a network is installed. Several projects provide kubernetes pod networks using CNI ( Container network interface ) and we will be using one from the weave cloud

Run the below commands to get the Pod Network running and master to ready state,
export kubever=$(kubectl version | base64 | tr -d '\n')
kubectl apply -f "https://cloud.weave.works/k8s/net?k8s-version=$kubever"

Once we execute the above commands , we see that there are couple of service accounts being created. If all goes well and we run the get pods commands as,
We will be able to see all the Pods running and also the  master in Ready State.

[root@manja17-I13330 ~]# kubectl get nodes
NAME                   STATUS    ROLES     AGE       VERSION
manja17-i13330    Ready      master    1d           v1.10.1

Now that all are up and running we are done with our master. We need to configure the worker node. In the next article we will see how to configure the nodes.


Read More