Pages

Friday, April 26, 2019

Jenkins - Integrating with Github

One of the basic steps of implementing CI/CD is integrating the SCM ( Source Code Management ) tool like git and github with CI tool. This saves time by building the source code when there is change done to the code.

In this article we will see how we can configure Github with Jenkins running on a Aws Instance. We will integrate jenkins and github in such a way that if there is any change made to the source code on Github, it will trigger a build on the Jenkins server.

Configure the Aws Instance and Install Jenkins on that server :
Create a seperate Security Group in for the jenkins server as below,
Open the Amazon EC2 console at https://console.aws.amazon.com/ec2/.
In the navigation bar, verify that US West (Oregon) is the selected
region.
In the left-hand navigation bar, choose Security Groups, and then click
Create Security Group : In Security group name enter WebServerSG and provide a description and Choose your VPC from the list.
 
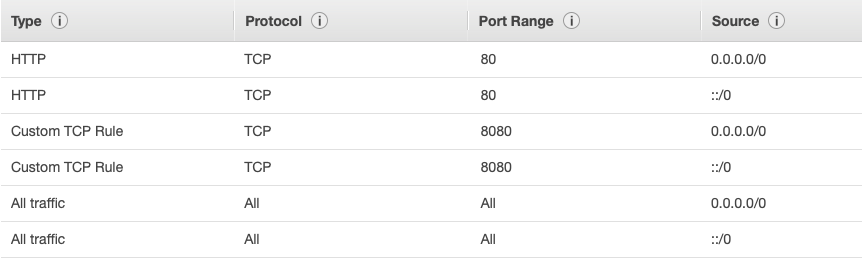
Create the rules in the inbound list of the Security Group as above.

While creating the instance,
Choose enable to “Auto-assign Public IP”.
choose the security group created above “WebSererSG”.

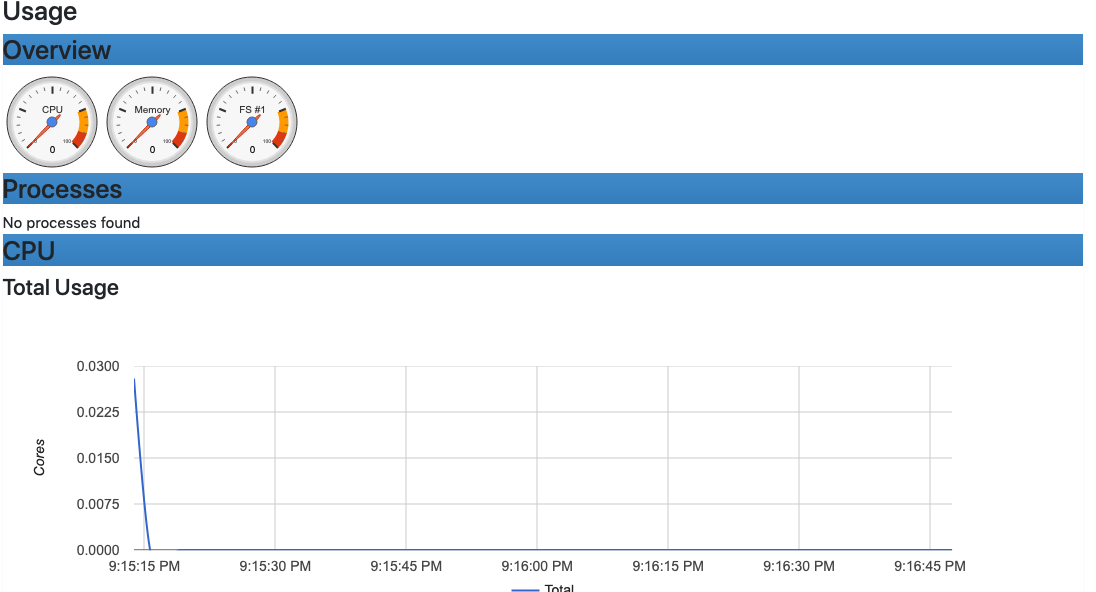
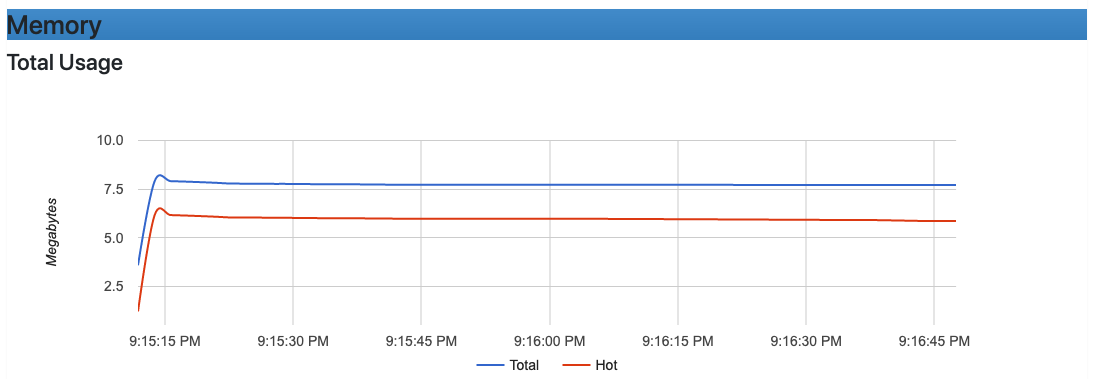
Once the instance is up and running , install java and jenkins.

Configure the Github plugin on the Jenkins Server
Once we install the github plugin go to Manage Jenkins -> Configure System and configure the plugin. We need to first configure the integration between jenkins running on our machine and the public github. One important thing we need to remember is that github can talk to servers running only public ip address. This is the reason why we have enabled the public ip while configuring the instance.
 
Under the Configure System, add a Github Server.
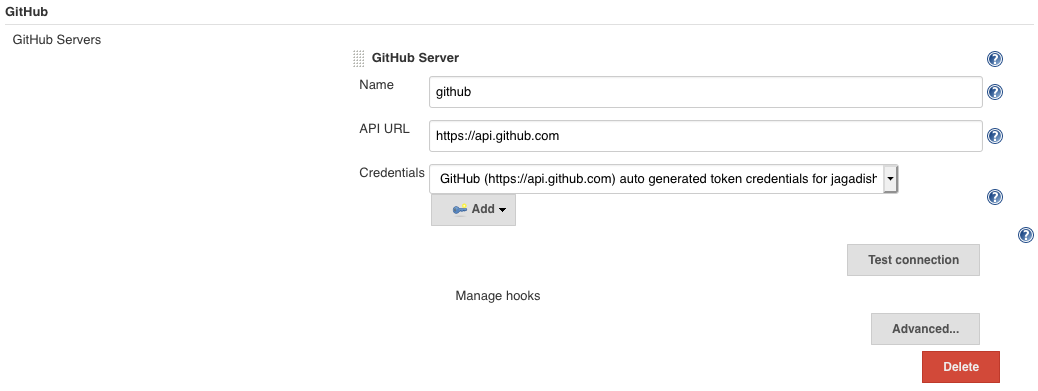
One another important thing to note is that the Github server does not accept credentials created using user name and password. For this we need to first we need to create a credential with the github username and password to login.

Under the Github Server section, click on the advanced button. Under this it shows a shared secret drop down. This will list the credential created in the above. Choose that and click on the “create token credentials”.

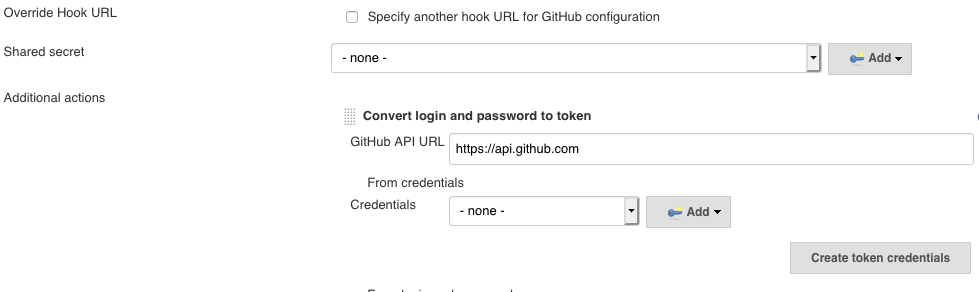
Once we click on the create token , it will create a token based credential in the jenkins server and the name will start with something Github. Now go back to the github server, and choose the credential created as token.
This looks something like above. Test the connection to make sure jenkins server is connected to the Github. Make sure the manage hooks is checked.

Another important thing that we need to do is to create a shared key. Now go to Credentials and create a secret key with any value. I have chosen the value "githubjenkins" and create a credential. Now this will used with the github Server in Configure System. Go back to Configure System -> under the Github Server configuration , click advanced and in the shared secret , choose the secret key credential created.
remember the secret key that we used above because we will be using that when configuring the webhook on the github. save the configuration 

On the Github Side -
Go to the Github Repo -> Settings -> Webhooks

Payload URL: http://<IP address>:8080//github-webhook/ ( make sure you have tailing "/" at last, this is very important )
Content type : application/json
Secret : give the secret "
githubjenkins" in here
 For the event, choose “let me select individual events” and under that choose push and pull

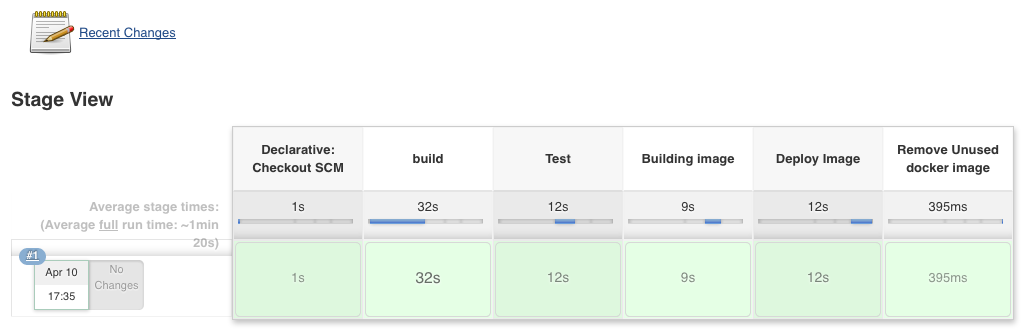
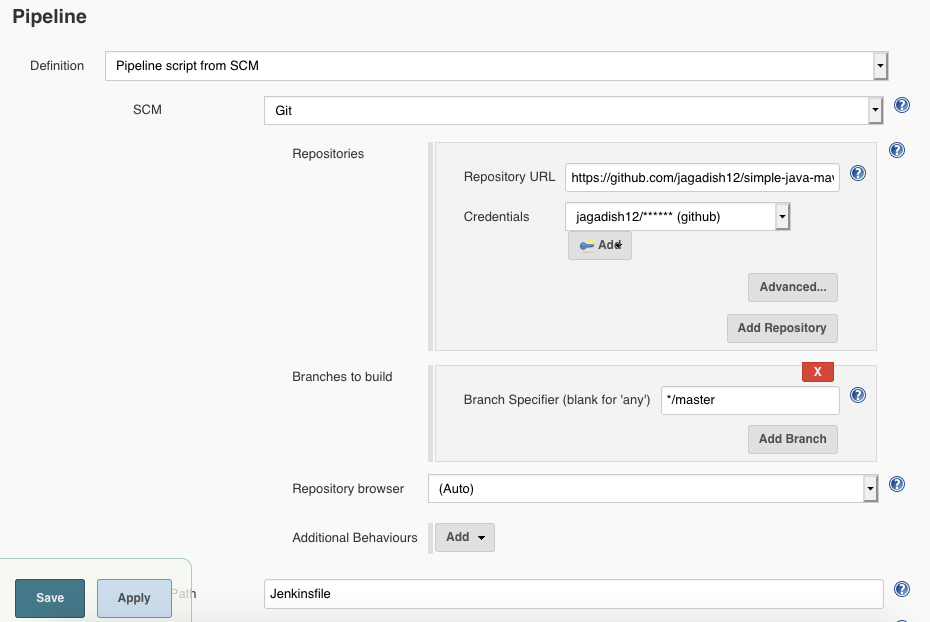
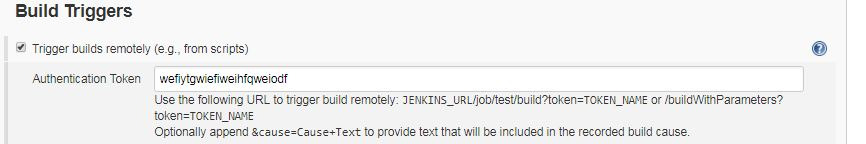
Configure a Job on jenkins that will get triggered by committing to the Github repo: Configure any type of job but in order to get triggered by a github commit all we need to is to choose “GitHub hook trigger for GITScm polling” under the build triggers. We also need to configure the git with the same repo from which we want to trigger the hook. in my case iam triggering the webhook from the sampleTest project in github. on the Job side, i have to choose the SCM as git and provide this github repo details and credentials details to connect. If we dont do this git configuration we will not be triggered when we commit some thing on the github. this is a very important step.Check the box before this option and save your job.

Now commit a change on the Github side and see that job is triggered on the jenkins side.
Read More

Tuesday, April 23, 2019

kubernetes - Horizontal Pod Accelerator

Having your services inside a container is good, but managing the services during peak time is hard. What if the service that we are running inside a pod is getting heavy load and consuming high cpu?. How can we make our pod scale when there is high cpu consumption?

Container orchestration tools like kubernetes provide a way to scale the number of pods when the service in pod expects heavy load. Hpa ( Horizontal pod accelerator) in kubernetes provides a way of autoscaling the pods based on the cpu load that happens on the infrastructure.  Hpa scales the number of pods in a replication controller, deployment or replica set based on observed CPU utilization. Using hpa we can configure our cluster to automatically scale the pod up or down.

There are couple of factors that affect the number of pods include:
1. A minimum and maximum number of pods allowed to run defined by the user
2. Observed CPU/Memory usage, as reported by resource metrics
3. Customer metrics provided by the third party metrics like prometheus

Hpe improves your services by:
1. Releasing hardware resources that would otherwise be wasted by an excessive number of pods
2. Increase/decrease performance as needed to accomplish service level agreements.

1. Install the kubernetes metrics Server : Clone the metrics-server using ,
git clone https://github.com/kubernetes-incubator/metrics-server.git

Edit the file deploy/1.8+/metrics-server-deployment.yaml to add a command section that did not exist. The command sections looks as,
containers:
      - name: metrics-server
        image: k8s.gcr.io/metrics-server-amd64:v0.3.1
        command:
          - /metrics-server
          - --kubelet-insecure-tls


This new section will let metrics-server to allow for an insecure communication  which involves not verifying the certs involved.

Once done, deploy the server using kubectl create -f deploy/1.8+/
The metrics-server will be deployed to the kube-system namespace. Once ran, give couple of minutes to gather the metrics.

The kubernetes metrics-server can be very useful in keeping an eye on the underlying infrastructure and pods that are running. The project is not officially part of kubernetes cluster which requires manual installation. This has 2 parts metrics-server and the metrics api. The Metrics-server is a cluster wide aggregator of resource usage data which collects metrics from the summery API exposed by kubelet on each node.

The metrics server will keep an eye on the underlying nodes and pods running. Run the top node and top pod command along with kubectl command. Run the command to see the details of the node and pod using,
jagadishm@192.168.31.177:/Volumes/Work/$ kubectl top node
NAME                      CPU(cores)   CPU%      MEMORY(bytes)   MEMORY%   
docker-for-desktop   650m           32%       1408Mi                74%       

jagadishm@192.168.31.177:/Volumes/Work/$ kubectl top pod
NAME                                            CPU(cores)   MEMORY(bytes)   
load-generator-7bbbb4fdd4-vfvrk    0m              0Mi             
php-apache-5d75bdc65f-rtvtr         1m              16Mi            

2. Create a Pod which can take load - this is simple php application which when hit by the service perform some cpu insensitive operations.

In the Dockerfile
FROM php:5-apache
ADD index.php /var/www/html/index.php
RUN chmod a+rx index.php
index.php
<?php
  $x = 0.0001;
  for ($i = 0; $i <= 1000000; $i++) {
    $x += sqrt($x);
  }
  echo "OK!";
?>


Build a image by the name php-apache. Upload to a dockerhub and run the container using ,kubectl run php-apache --image=docker.io/jagadesh1982/php-apache --requests=cpu=200m --expose --port=80

Once both deployment and service are created,lets create a hpa

Create hpa - The autoscaler can be created by a yaml file or a kubectl autoscale command.run the below command to create a hpa using,
kubectl autoscale deployment php-apache --cpu-percent=50 --min=1 --max=10
horizontalpodautoscaler.autoscaling/php-apache autoscaled

The autoscaler command will create a hpa which will maintain replicates between 1 and 10 of the pods managed by the php-apache deployment. Hpa will increase or decrease the number of php-apache pod replicas to maintain an average cpu utilization across all pods to 50% since we have assigned 200 mill-cores to each pod.

Check the hpa using,
 
We can see that the target show 0%/50% which means we don't have any load.
 
Run a load generator : Run a busy box container from which we continuously hit the php-apache service using a while loop. Run the kubectl run -i --tty load-generator --image=busybox /bin/sh command and once command prompt comes , enter the command while true; do wget -q -O- http://php-apache.default.svc.cluster.local; done to continuously hit the php-apache service

jagadishm@10.135.114.187:/Volumes/Work$ kubectl run -i --tty load-generator --image=busybox /bin/sh
If you don't see a command prompt, try pressing enter.
/ # while true; do wget -q -O- http://php-apache.default.svc.cluster.local; done
OK!
OK!

After few minutes, we can see load in the hpa. The targets in the hpa show different values with increasing. We can then check the pods to see that the pods are replicated as below,
jagadishm@192.168.31.177:/Volumes/Work$ kubectl get pods
NAME                                         READY     STATUS    RESTARTS    AGE
load-generator-7bbbb4fdd4-vfvrk 1/1          Running       0              5m
php-apache-5d75bdc65f-9hfq8     1/1          Running       0              42s
php-apache-5d75bdc65f-bqb9s     1/1          Running      0              42s
php-apache-5d75bdc65f-rgfpg      1/1          Running      0              42s
php-apache-5d75bdc65f-rtvtr       1/1          Running      0              1h

We can see that when the target machine are seeing some load and based on the hpa that we created, the pod of php-apache are replicated. This way we can extend our service pod based on the infrastructure changes.

Read More

kubernetes - What's inside Etcd?

Etcd is a simple distributed key-value store which uses the Raft algorithm. Kubernetes use Etcd to store information on what's happening in the cluster. Whatever happens in the cluster like creating pods, services, pods details like where they are created etc, all these details will be saved inside the etcd server.

In this article we will see how we can connect to the etcd server , access its datasource and see how things work.

How to get into the Etcd Pod
Every kubernetes cluster has a etcd configured. The api server is the only component in the whole cluster who can talk to the etcd. Whatever we want to do in the cluster, like creating pod, destroying etc will be first sent to the api server and then api server talks to the etcd to delete the requested details and then performs the actions requested.

Api server will  have the certificates to connect to the etcd server. If we go to the /etc/kubernetes/manifests location in the kubernetes master node, we can see the yml files for creating the kube-system pods. We can also see the etcd.yml file which gives us much information about the etcd server. In the manifest file, we can see how etcd is started and how it can be accessed as below,
containers:
  - command:
    - etcd
    - --advertise-client-urls=https://10.0.2.15:2379
    - --cert-file=/etc/kubernetes/pki/etcd/server.crt
    - --client-cert-auth=true
    - --data-dir=/var/lib/etcd
    - --initial-advertise-peer-urls=https://10.0.2.15:2380
    - --initial-cluster=logging.machine.vm=https://10.0.2.15:2380
    - --key-file=/etc/kubernetes/pki/etcd/server.key
    - --listen-client-urls=https://127.0.0.1:2379,https://10.0.2.15:2379
    - --listen-peer-urls=https://10.0.2.15:2380
    - --name=logging.machine.vm
    - --peer-cert-file=/etc/kubernetes/pki/etcd/peer.crt
    - --peer-client-cert-auth=true
    - --peer-key-file=/etc/kubernetes/pki/etcd/peer.key
    - --peer-trusted-ca-file=/etc/kubernetes/pki/etcd/ca.crt
    - --snapshot-count=10000
    - --trusted-ca-file=/etc/kubernetes/pki/etcd/ca.crt
    image: k8s.gcr.io/etcd:3.3.10
    imagePullPolicy: IfNotPresent
    livenessProbe:
      exec:
        command:
        - /bin/sh
        - -ec
        -ETCDCTL_API=3 etcdctl --endpoints=https://[127.0.0.1]:2379 --cacert=/etc/kubernetes/pki/etcd/ca.crt
          --cert=/etc/kubernetes/pki/etcd/healthcheck-client.crt --key=/etc/kubernetes/pki/etcd/healthcheck-client.key
          get foo
      failureThreshold: 8
      initialDelaySeconds: 15
      timeoutSeconds: 15
    name: etcd
    resources: {}
    volumeMounts:
    - mountPath: /var/lib/etcd
      name: etcd-data
    - mountPath: /etc/kubernetes/pki/etcd
      name: etcd-certs
  hostNetwork: true
If we see the above manifest file, we can see the client interface is bound to 127.0.0.1 which means we are able to access to etcd only using localhost. The port is 2379 default port for etcd and the -client-cert-auth=true says that the certificate authentication is activated. This means we need to have certificates in order to connect to the etcd.

Also we can see the data is stored in the /var/lib/etcd location from host machine. This means the data is being stored in the host machine /var/lib/etcd location.

First connect to the etcd server and find the location of the certificates,
[root@logging ~]# kubectl exec -it --namespace kube-system kube-apiserver-logging.machine.vm sh
# cd /etc/kubernetes/pki
# ls
apiserver-etcd-client.crt     apiserver-kubelet-client.key  ca.crt  front-proxy-ca.crt        front-proxy-client.key
apiserver-etcd-client.key     apiserver.crt            ca.key  front-proxy-ca.key        sa.key
apiserver-kubelet-client.crt  apiserver.key            etcd    front-proxy-client.crt  sa.pub
# exit
We can see that the certificates are located at /etc/kubernetes/pki location in the kube-apiserver pod.

Lets download the keys that are necessary for connecting to the etcd,
[root@logging ~]# kubectl cp --namespace kube-system kube-apiserver-logging.machine.vm:etc/kubernetes/pki/apiserver-etcd-client.crt apiserver-etcd-client.crt

[root@logging ~]# kubectl cp --namespace kube-system kube-apiserver-logging.machine.vm:etc/kubernetes/pki/apiserver-etcd-client.key apiserver-etcd-client.key

[root@logging ~]# ll
total 28
-rw-r--r--. 1 root root 1090 Apr 12 02:11 apiserver-etcd-client.crt
-rw-r--r--. 1 root root 1675 Apr 12 02:11 apiserver-etcd-client.key

Copy the above downloaded certificates to the etcd server,
[root@logging ~]# kubectl cp --namespace kube-system apiserver-etcd-client.crt etcd-logging.machine.vm:etc/kubernetes/pki/etcd/
[root@logging ~]# kubectl cp --namespace kube-system apiserver-etcd-client.key etcd-logging.machine.vm:etc/kubernetes/pki/etcd/

Connect to the kube-apiserver using,

[root@logging ~]# kubectl exec -it --namespace kube-system kube-apiserver-logging.machine.vm sh
 
We need to set etcdctl tool to v3 API version using following environment variable: export ETCDCTL_API=3

One we set the etcdctl, we can then connect to the local etcd server using,
/etc/kubernetes/pki/etcd # etcdctl --cacert=ca.crt --key=apiserver-etcd-client.key --cert=apiserver-etcd-client.crt endpoint status
127.0.0.1:2379, f074a195de705325, 3.3.10, 1.4 MB, true, 2, 9248

Understand the Data
/etc/kubernetes/pki/etcd # etcdctl --cacert=ca.crt --key=apiserver-etcd-client.key --cert=apiserver-etcd-client.crt get / --prefix
 --keys-only


/registry/apiregistration.k8s.io/apiservices/v1.
/registry/apiregistration.k8s.io/apiservices/v1.apps
/registry/apiregistration.k8s.io/apiservices/v1.authentication.k8s.io
/registry/apiregistration.k8s.io/apiservices/v1.authorization.k8s.io

The output is too large. We just got a snippet of the content.
/registry/minions/logging.machine.vm : This contains the location of the node details. In this case logging.machine.vm is the node name. This contains many details regarding the node.

To get the details we can use the same above command by passing the location to it as,
/etc/kubernetes/pki/etcd # etcdctl --cacert=ca.crt --key=apiserver-etcd-client.key --cert=apiserver-etcd-client.crt get /registry/minions/logging.machine.vm

/registry/namespaces/ : Namespace details. This list all the available namespaces. We can pass the namespace to the location to get status of the namespace whether active or terminated.

/registry/pods/{namespace}/{pod name} - State of every pod running in cluster. Contains a lot of information like pod IP, mounted volumes, docker image etc.

/registry/ranges/servicenodeports - Ports range for exposing services
/registry/secrets/{namespace}/{pod} - All secrets in cluster stored as plain text in default mode

This way we can connect to the etcd server running in the kubernetes cluster and gather more details about the things running inside a cluster.
Read More

Wednesday, April 10, 2019

Full Build Automation For Java application Using Docker Containers

In this pipeline implementation, we will be using Dockers containers fully. We will be using docker for building our java application. We will run Jenkins inside a Docker container, start maven container from Jenkins container to build our code, Run test cases in another Maven Container, Generate the artifact ( jar in this case ), then Build a docker image inside the Jenkins Container itself and push that to the Docker Hub at the end from Jenkins Container.
For this Pipeline , we will be using 2 Github repositories.
1. Jenkins-complete - This is the main repository. This repo contains configuration files for starting Jenkins Container.

2. Simple-java-maven-app - This is our sample java application created using maven. 

We need to understand both repo before building this automation. 

Understanding Jenkins-complete
This is the core repository as this will contain all necessary files that build our jenkins image. Jenkins officially provides a Docker Image by which we can start the container. Once the container is started, we need to perform many things as installing plugins, creating a user etc. 


Once these are created, we need then create credentials for Github to check our sample java application, and a Docker credential for pushing the finally created docker image to dockerhub. Finally we have to create the pipeline job in Jenkins for building our application.

This is a long process our goal is to completely automate all these things. This repo contains files and configuration details which will be used while creating the image. Once the image is created and ran , we have

  1. User admin/admin created
  2. Plugins installed
  3. Credentials for Github and Docker are created
  4. Pipeline job with name sample-maven-job is created.
If we checkout the source code and do a tree, we can see the below structure,
jagadishmanchala@Jagadish-Local:/Volumes/Work$ tree jenkins-complete/
jenkins-complete/
├── Dockerfile
├── README.md
├── credentials.xml
├── default-user.groovy
├── executors.groovy
├── install-plugins.sh
├── sample-maven-job_config.xml
├── create-credential.groovy
└── trigger-job.sh


Lets see what each file talks about
default-user.groovy - this is the file that creates the default user admin/admin.
 

executors.groovy - this is the groovy script that sets the executors in the jenkins server with value 5. A Jenkins executor can be treated as single process which allow a Jenkins job to run on a respective slave/agent machine.

create-credential.groovy - Groovy script for creating credentials in the jenkins global store. This file can be used to create any credential in the jenkins global store. This file is used to create Docker hub credentials. We need to change the username and secret entries in the file by adding our docker hub username and password. This file will be copied to the image and ran when the server starts up

credentials.xml - this is the xml file which will contain  our credentials. This file contain credentials for both Github and Docker. The credential looks like below,
 <com.cloudbees.plugins.credentials.impl.UsernamePasswordCredentialsImpl>
          <scope>GLOBAL</scope>
          <id>github</id>
          <description>github</description>
          <username>jagadish***</username>
   <password>{AQAAABAAAAAQoj3DDFSH1******</password>      </com.cloudbees.plugins.credentials.impl.UsernamePasswordCredentialsImpl>

If you see the above snippet, we have the id as “github”, username and encrypted password. The id is very important as we will be using this in the pipeline job that we create.

How can i get the encrypted values for my password
In order to get encrypted content for your password, go to a running jenkins server -> Manage Jenkins -> Script console.In the text field it provides enter the code,
import hudson.util.Secret
def secret = Secret.fromString("password")
println(secret.getEncryptedValue())


In the place of password, enter your password which when you run gives you the encrypted password. You can paste the content in the credentials.xml file.
The same thing is used to generate the DockerHub password too. 


sample-maven-job_config.xml - this is the xml file which contains our pipeline job details. This will be used by the jenkins to create a job by the name “sample-maven-job” in the Jenkins console. This job will be configured with the details defined in this xml file.

The configuration is simple, Jenkins will read this file to create a job “sample-maven-job” pipeline job, sets the SCM pointing to the github location. This will also be configured with the credential set to “github” id. This looks something like this,


Once the scm is set, it also set the job with a Token for triggering the job remotely. For this we have to enable the “trigger builds remotely” and provide a token over there. This is available under the “Build Triggers” section in the pipeline job. I have given the token as “MY-TOKEN” which will be used in our shell script to trigger the job.


trigger-job.sh - This is simple shell script which contains a Curl command for running the job.

Though we create the entire jenkins Server inside a container, and create a job. We need a way to trigger that job in order to make that whole build automated. I preferred a way of

  1. Creating the jenkins docker container with all necessary things like job creation, credentials, users etc
  2. Trigger the job once the container is up and running.
I have written this simple shell script to trigger the job once the container is up and running. The shell script is simple curl command sending a post request to the jenkins server. The content looks something like this,

jagadishmanchala@Jagadish-Local:/Volumes/Work/jenkins-complete$cat trigger-job.sh
#!/bin/bash

HOSTNAME=`hostname -i`
curl --silent -I -u admin:admin http://$HOSTNAME:8080/job/sample-maven-job/build?token=MY_TOKEN

As said earlier, we will be using the token “MY_TOKEN” that we configured in the build triggers earlier. We use that in the curl command to trigger our job.

Install-plugins.sh - This is the script that we will use to install the necessary plugins. We will copy this script to the jenkins images passing the plugin names as arguments. Once the container is started, the script is ran taking the plugins as arguments and are installed.


Dockerfile - The most important file in this automation. We will use the Docker file to build the whole jenkins server with all configurations. Understanding this file is very important if you want to write your own build automations.

FROM jenkins/jenkins:lts - We will be using the jenkins image provided officially. 

ARG HOST_DOCKER_GROUP_ID  - One important things to keep in mind is that though we create Docker containers from the jenkins Docker container, we are not actually creating containers inside the jenkins rather we  are creating them on the host machine itself. This means we tell the docker tool installed inside the jenkins docker container to delegate the request of creating the maven container to the host machine. In order for the delegation to happen we need to have the same groups configured on the jenkins docker container and on host machine

To allows access for a non-privileged user like jenkins, we need to add jenkins user to the docker group. In order to make things works, we must assures that the docker group inside the container has the same GID as the group on the host machine. The groupid can be obtained using the command “getent group docker”

Now the HOST_DOCKER_GROUP_ID is set as build argument which means we need to send the groupid for the docker on host machine to the image file while building this. We will sending this value as an argument which building that.

# Installing the plugins we need using the in-built install-plugins.sh script
RUN install-plugins.sh pipeline-graph-analysis:1.9 \
    cloudbees-folder:6.7 \
    docker-commons:1.14 \

The next instruction is to run the “install-plugins.sh” script passing the plugins to be installed as arguments. The script is provided by default or we can copy from our host machine.

# Setting up environment variables for Jenkins admin user
ENV JENKINS_USER admin
ENV JENKINS_PASS admin

We set the JENKINS_USER and JENKINS_PASS environment variables. These variables are passed to the default-user.groovy script for creating user admin with password admin.

# Skip the initial setup wizard
ENV JAVA_OPTS -Djenkins.install.runSetupWizard=false

This lets jenkins to be installed in silent mode

# Start-up scripts to set number of executors and creating the admin user
COPY executors.groovy /usr/share/jenkins/ref/init.groovy.d/
COPY default-user.groovy /usr/share/jenkins/ref/init.groovy.d/
COPY create-credential.groovy /usr/share/jenkins/ref/init.groovy.d/

The above scripts as we discussed will set the executors to 5 and create a default user admin/admin.

One important thing to remember here is, if we check the jenkins official Docker image we will see a VOLUME set to /var/jenkins_home. This means this is the home directory for our jenkins server similar to /var/lib/jenkins when we install on physical machine.

But once a volume is attached, only root user has the capability to edit files, add files over there. In order to let non-privileged user “jenkins” to copy content to this location, jenkins provides us a way. Copy all the scripts, configuration files etc to the location /usr/share/jenkins/ref/ location. Once the container is started, the jenkins will take care of copying the content from this location to the /var/jenkins_home as jenkins users.

Similarly scripts copied to /usr/share/jenkins/ref/init.groovy.d/ will be executed when the server gets started up.

# Name the jobs 
ARG job_name_1="sample-maven-job"
RUN mkdir -p "$JENKINS_HOME"/jobs/${job_name_1}/latest/ 
RUN mkdir -p "$JENKINS_HOME"/jobs/${job_name_1}/builds/1/
COPY ${job_name_1}_config.xml /usr/share/jenkins/ref/jobs/${job_name_1}/config.xml
COPY credentials.xml /usr/share/jenkins/ref/
COPY trigger-job.sh /usr/share/jenkins/ref/

In the above case, iam setting my job name as “sample-maven-job” and creating the directories and copying the files. 


RUN mkdir -p "$JENKINS_HOME"/jobs/${job_name_1}/latest/ 
RUN mkdir -p "$JENKINS_HOME"/jobs/${job_name_1}/builds/1/

The above 2 instructions are very important, these create a jobs directory in the jenkins home where we need to copy the job configuration file. The latest and builds/1 are also need to be created in the job location for that specific job.

Once these are created, we are copying our “sample-maven-job_config.xml” file to the /var/share/jenkins/ref and asking jenkins to copy the file to the /var/jenkins_home/jobs/ as sample-maven-job.

Finally we are also copying the  credentials.xml and trigger-job.sh files to the /usr/share/jenkins/ref. Once the container is started, all content available in this location will be moved to /var/jenkins_home as jenkins user.

USER root
#RUN chown -R jenkins:jenkins "$JENKINS_HOME"/
RUN chmod -R 777 /usr/share/jenkins/ref/trigger-job.sh

# Create 'docker' group with provided group ID
# and add 'jenkins' user to it
RUN groupadd docker -g ${HOST_DOCKER_GROUP_ID} && \
    usermod -a -G docker jenkins

RUN apt-get update && apt-get install -y tree nano curl sudo
RUN curl https://get.docker.com/builds/Linux/x86_64/docker-latest.tgz | tar xvz -C /tmp/ && mv /tmp/docker/docker /usr/bin/docker
RUN curl -L "https://github.com/docker/compose/releases/download/1.23.1/docker-compose-$(uname -s)-$(uname -m)" -o /usr/local/bin/docker-compose
RUN chmod 755 /usr/local/bin/docker-compose
RUN usermod -a -G sudo jenkins
RUN echo "jenkins ALL=(ALL:ALL) NOPASSWD:ALL" >> /etc/sudoers

RUN newgrp docker
USER jenkins

The next instructions are executed as root user.  Under the root instructions we are creating the docker group with the same groupid as host machine passed as argument. Then we are modifying the jenkins user by adding that to the docker group. By this we can create container from the jenkins user. This is very important as docker container can only be created by root user. In order to create them with jenkins, we need to add the jenkins user to the docker group which we are doing.

In the next instructions, we are installing the docker-ce and docker-compose tools. We are also setting the permissions on the docker-compose tool. Finally we are also adding the jenkins to the sudoers file to give certain permissions root user

RUN newgrp docker
This instruction is very important. When ever we modify the groups of a user, we need to logout and login to reflect the changes.  In order to bypass the logout and login we use this “newgrp docker” instruction to reflect the changes. Finally we change back to the jenkins user.

Build the Image - Once we are good with the Docker file, to create a image from this we need to run,
docker build --build-arg HOST_DOCKER_GROUP_ID="`getent group docker | cut -d':' -f3`" -t jenkins1 .

From the location where we have our Dockerfile, run the above docker build instruction. In the above command, we are passing the build-arg with the value of the groupid for the docker user. This value will be passed to the “HOST_DOCKER_GROUP_ID” which will be used to create the same groupid in jenkins Docker container. The Image build will take some time since it need to download and install the plugins for jenkins servers.

Running the Image - Once the Image is built, we need to run the container as
docker run -itd -v /var/run/docker.sock:/var/run/docker.sock  -v $(which docker):/usr/bin/docker -p 8880:8080 -p 50000:50000 jenkins1

Two important things in here are that volume that we are mounting. We are mounting the docker command line utility to the container, so that if another container need to be created from container, this can be used.

The most important one is the /var/run/docker.sock mount. Docker.sock is a UNIX socket that docker daemon is listening to. This is the main entrypoint for Docker API. this can also be a TCP socket but by default for security reasons it is UNIX socket.

Docker uses this socket to execute docker command by default. The reason why we mount this to a docker container is to launch new containers from container. This can also be used for auto service discovery and logging purpose. This increases attack surface so we need to be very careful mounting this.

Once the command is ran, we will get the jenkins container up and running. Use the URL “<ip address>:8880” to see the Jenkins console. Once the console is up, login using “admin/admin”. We will see our sample-maven-job created with SCM, Token and credentials But not ran yet

Running the JOB - In order to run the job, all we have to do is to take the containerID and run the trigger-job.sh job as below,

docker exec <Jenkins Container ID> /bin/sh -C /var/jenkins_home/trigger-job.sh

Once you run the command we can see the building the pipeline job get started.


Understanding simple-java-maven-app
As we already said this repo contains our java application. The application is created using maven artifacts. The repo contains a Dockerfile, Jenkinsfile and Source code. The source code is quite similar as other maven based applications.

Jenkinsfile - The Jenkins file is the core file that will be ran when the sample-maven-job is started. The pipeline job download the source code from the github location using the github credential.

The most important thing in the Jenkinsfile is the agent definition. We will be using “agent any” for building our java code from any available agents. But we will define agents when we go to specific stages to run the stage.

stage("build"){
        agent {
                docker {
                    image 'maven:3-alpine'
                    args '-v /root/.m2:/root/.m2'
                  }
             }
      
       steps {
              sh 'mvn -B -DskipTests clean package'
                stash includes: 'target/*.jar', name: 'targetfiles'
            } 
   

If you see the above stage, we are setting the agent as docker with image file “maven:3-alpine”. So jenkins will trigger a docker run maven:3-alpine container and run the command defined in the steps as “mvn -B -DskipTests clean package”

Similarly the test cases are also ran in the same way. It trigger a docker run with the maven image and then run the “mvn test” on the source code.

environment {
    registry = "docker.io/<user name>/<image Name>"
    registryCredential = 'dockerhub'
    dockerImage = ''
}


The other important this is the environment definition. I have defined the registry name as “docker.io/jagadesh1982/sample” which mean when we create a image with the final artifact (jar), the image name will be “docker.io/jagadesh1982/sample:<version>. This is very important if you want to push the images to the dockerhub. Dockerhub expects to have the image name with “docker.io/<user Name>/<Image Name>” in order to upload.

Once the building of the image is done, it is then uploaded to the DockerHub and then removed from the jenkins docker container.

Dockerfile - This repo also contains a Dockerfile which will be used to create a docker image with the final artifact. This means it copies the my-app-1.0-SNAPSHOT.jar to the docker image. It also run the container from image.

Hope this helps, More to Come. Happy learning :-)
Read More

Tuesday, April 9, 2019

Container Monitoring - Container Advisor (CAdvisor)

CAdvisor is a open source container resource usage collector Which contains a native support for docker containers. CAdvisor works per node basis. Once a node is installed with the CAdvisor container it auto discovers all containers in the given node and collect CPU, memory , file system and network usage statistics. This provides the overall machine usage by analyzing the root container on the machine.

CAdvisor also supports exporting stats to various storage plugins like elasticsearch, influxDB etc. The collected metrics can be viewed on WEB-UI which exports live information about all containers on the machine. This also exposes raw and processed stats via a versioned remote REST Api.

Running CAdvisor - Run the cadvisor container by using the docker run command as below,
jagadishAvailable$Thu Mar 21@ docker run --volume=/:/rootfs:ro --volume=/var/run:/var/run:rw --volume=/sys:/sys:ro --volume=/var/lib/docker/:/var/lib/docker:ro --volume=/dev/disk/:/dev/disk:ro --publish=18080:8080 --detach=true --name=cadvisor google/cadvisor:latest
Unable to find image 'google/cadvisor:latest' locally
latest: Pulling from google/cadvisor
ff3a5c916c92: Already exists
44a45bb65cdf: Pull complete
0bbe1a2fe2a6: Pull complete

Digest: sha256:815386ebbe9a3490f38785ab11bda34ec8dacf4634af77b8912832d4f85dca04
Status: Downloaded newer image for google/cadvisor:latest
6d3b3178af72f40c42f197df1467b07b86f1331fd9f3aaa7b8bfa0c42994ef48

Once the container starts running, we can access the web application on “http://localhost:18080” url. below are the screenshots which gives us more details about the containers that run in the machine.


More to Come, Happy learning :-)
Read More

Monday, April 8, 2019

Complete Build Automation for Python Application Using Jenkins Pipeline

In this example pipeline, we will be deploying a python application using jenkins Pipeline code. The pipeline code includes checkout source code from Github, performs a quality scan using the pylint tool, does a unit test using the pytest tool and finally sends an email to the users.

1. Install the necessary tools python, pylint and pytest.

Installing Python  - Python will be by default available in all linux machines.

Installing Pylint - Pylint is a Python static code analysis tool which looks for programming errors, helps enforcing a coding standard, sniffs for code smells and offers simple refactoring suggestions.

Open a Command Prompt or Terminal. On Windows, navigate to the Python root directory (install location) and run the following command: python -m pip install pylint


Installing Pytest - Installing pytest is same as pylint. Open a Command Prompt or Terminal. On Windows, navigate to the Python root directory (install location) and run the following command: pip install -U pytest

Plugins to Install - There are couple of Jenkins plugin to be installed for the below pipeline to work. The plugins are warnings and publishHTML.

2. Create a Jenkins pipeline job, with scm pointing to the below github location. Download the source from here and create your own github repository.

3. Understanding the Jenkinsfile. The pipeline code has 3 different stages. The pipeline looks like below,

pipeline {
  agent any

 stages {
     stage('Checkout') {
            steps {
                git credentialsId: 'github-jenkins', url: 'https://github.com/jagadish12/funniest.git'
                echo 'CheckOut Success'
            }
        }

stage('lint'){
   steps {
        sh "virtualenv --python=/usr/bin/python venv"
        sh "export TERM='linux'"  
        sh 'pylint --rcfile=pylint.cfg funniest/ $(find . -maxdepth 1 -name "*.py" -print) --msg-template="{path}:{line}: [{msg_id}({symbol}), {obj}] {msg}" > pylint.log || echo "pylint exited with $?"'
        sh "rm -r venv/"
       
        echo "linting Success, Generating Report"
         
        warnings canComputeNew: false, canResolveRelativePaths: false, defaultEncoding: '', excludePattern: '', healthy: '', includePattern: '', messagesPattern: '', parserConfigurations: [[parserName: 'PyLint', pattern: '*']], unHealthy: ''
       
       }   
     }
      
stage('test'){
   steps {
         
        sh "pytest --cov ./ --cov-report html --verbose"
        publishHTML(target:
            [allowMissing: false,
              alwaysLinkToLastBuild: false,
            keepAll: false,
            reportDir: 'htmlcov',
            reportFiles: 'index.html',
            reportName: 'Test Report',
            reportTitles: ''])  
           
        echo "Testing Success"   
          }  
        }
       
stage('mail'){
        steps{
            emailext attachLog: true, body: 'Jenkins Build - Status Report', subject: 'Build Report', to: 'jagadesh.manchala@gmail.com'
        }
    }   

       }
}

The Pipeline contains 4 stages, checkout , lint , test and email.

Checkout - Create a Credential with the name “github-jenkins”. The same credential will be used to check out source code form the github.
   
stage('Checkout') {
            steps {
                git credentialsId: 'github-jenkins', url: 'https://github.com/jagadish12/funniest.git'
                echo 'CheckOut Success'
            }
        }

Lint - the seconds stage is the lint stage. In this stage we will run linting ( quality scan ) using the pylint tool. We will create a python virtualenv and perform the pylint testing inside the virtual environment.  Once the linting of the python code is done, the results will be displayed with the warning plugin in Jenkins.

stage('lint'){
       steps {
        sh "virtualenv --python=/usr/bin/python venv"
        sh "export TERM='linux'"  
        sh 'pylint --rcfile=pylint.cfg funniest/ $(find . -maxdepth 1 -name "*.py" -print) --msg-template="{path}:{line}: [{msg_id}({symbol}), {obj}] {msg}" > pylint.log || echo "pylint exited with $?"'
        sh "rm -r venv/"
       
        echo "linting Success, Generating Report"
         
        warnings canComputeNew: false, canResolveRelativePaths: false, defaultEncoding: '', excludePattern: '', healthy: '', includePattern: '', messagesPattern: '', parserConfigurations: [[parserName: 'PyLint', pattern: '*']], unHealthy: ''
       
       }   
     }

Test - The third stage is testing stage in which we will use the pytest tool to do the unit testing for the code that we have written.

stage('test'){
      steps {
         
        sh "pytest --cov ./ --cov-report html --verbose"
        publishHTML(target:
            [allowMissing: false,
              alwaysLinkToLastBuild: false,
            keepAll: false,
            reportDir: 'htmlcov',
            reportFiles: 'index.html',
            reportName: 'Test Report',
            reportTitles: ''])  
           
        echo "Testing Success"   
          }  
        }

Email - the Final stage is sending the email to the user defined in this stage. I have given mine , you can change that.

The Complete source code is available here. More to Come, Happy learning :-)
Read More